There's Been No Shortage Of Growth Recently For Sinclair's (NASDAQ:SBGI) Returns On Capital
If you're looking for a multi-bagger, there's a few things to keep an eye out for. In a perfect world, we'd like to see a company investing more capital into its business and ideally the returns earned from that capital are also increasing. This shows us that it's a compounding machine, able to continually reinvest its earnings back into the business and generate higher returns. Speaking of which, we noticed some great changes in Sinclair's (NASDAQ:SBGI) returns on capital, so let's have a look.
The end of cancer? These 15 emerging AI stocks are developing tech that will allow early identification of life changing diseases like cancer and Alzheimer's.
What Is Return On Capital Employed (ROCE)?
Just to clarify if you're unsure, ROCE is a metric for evaluating how much pre-tax income (in percentage terms) a company earns on the capital invested in its business. The formula for this calculation on Sinclair is:
Return on Capital Employed = Earnings Before Interest and Tax (EBIT) ÷ (Total Assets - Current Liabilities)
0.10 = US$550m ÷ (US$5.9b - US$605m) (Based on the trailing twelve months to December 2024).
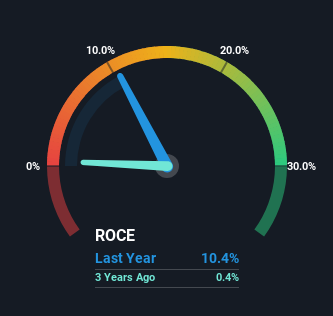
So, Sinclair has an ROCE of 10%. That's a relatively normal return on capital, and it's around the 9.1% generated by the Media industry.
Check out our latest analysis for Sinclair
Above you can see how the current ROCE for Sinclair compares to its prior returns on capital, but there's only so much you can tell from the past. If you're interested, you can view the analysts predictions in our free analyst report for Sinclair .
What The Trend Of ROCE Can Tell Us
You'd find it hard not to be impressed with the ROCE trend at Sinclair. We found that the returns on capital employed over the last five years have risen by 284%. That's a very favorable trend because this means that the company is earning more per dollar of capital that's being employed. Interestingly, the business may be becoming more efficient because it's applying 67% less capital than it was five years ago. If this trend continues, the business might be getting more efficient but it's shrinking in terms of total assets.
The Key Takeaway
From what we've seen above, Sinclair has managed to increase it's returns on capital all the while reducing it's capital base. Investors may not be impressed by the favorable underlying trends yet because over the last five years the stock has only returned 26% to shareholders. Given that, we'd look further into this stock in case it has more traits that could make it multiply in the long term.
One final note, you should learn about the 3 warning signs we've spotted with Sinclair (including 2 which are significant) .
For those who like to invest in solid companies, check out this free list of companies with solid balance sheets and high returns on equity.
If you're looking to trade Sinclair, open an account with the lowest-cost platform trusted by professionals, Interactive Brokers.
With clients in over 200 countries and territories, and access to 160 markets, IBKR lets you trade stocks, options, futures, forex, bonds and funds from a single integrated account.
Enjoy no hidden fees, no account minimums, and FX conversion rates as low as 0.03%, far better than what most brokers offer.
Sponsored ContentNew: Manage All Your Stock Portfolios in One Place
We've created the ultimate portfolio companion for stock investors, and it's free.
• Connect an unlimited number of Portfolios and see your total in one currency• Be alerted to new Warning Signs or Risks via email or mobile• Track the Fair Value of your stocks
Try a Demo Portfolio for FreeHave feedback on this article? Concerned about the content? Get in touch with us directly. Alternatively, email editorial-team (at) simplywallst.com.This article by Simply Wall St is general in nature. We provide commentary based on historical data and analyst forecasts only using an unbiased methodology and our articles are not intended to be financial advice. It does not constitute a recommendation to buy or sell any stock, and does not take account of your objectives, or your financial situation. We aim to bring you long-term focused analysis driven by fundamental data. Note that our analysis may not factor in the latest price-sensitive company announcements or qualitative material. Simply Wall St has no position in any stocks mentioned.
Disclaimer: Investing carries risk. This is not financial advice. The above content should not be regarded as an offer, recommendation, or solicitation on acquiring or disposing of any financial products, any associated discussions, comments, or posts by author or other users should not be considered as such either. It is solely for general information purpose only, which does not consider your own investment objectives, financial situations or needs. TTM assumes no responsibility or warranty for the accuracy and completeness of the information, investors should do their own research and may seek professional advice before investing.
Most Discussed
- 1
- 2
- 3
- 4
- 5
- 6
- 7
- 8
- 9
- 10