A Look At The Fair Value Of WiseTech Global Limited (ASX:WTC)
Key Insights
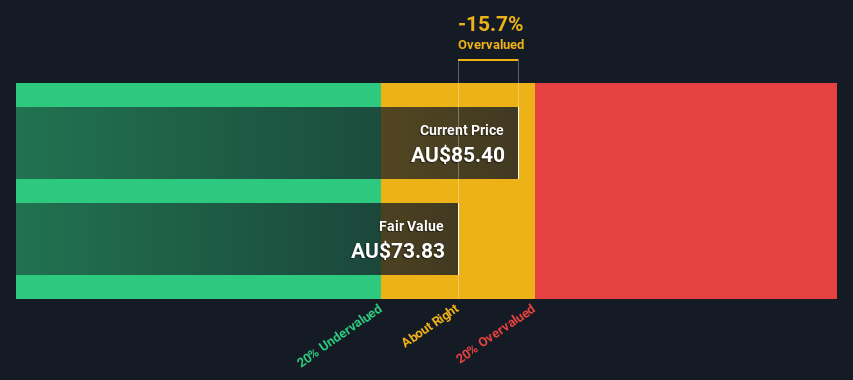
- WiseTech Global's estimated fair value is AU$73.83 based on 2 Stage Free Cash Flow to Equity
- WiseTech Global's AU$85.40 share price indicates it is trading at similar levels as its fair value estimate
- Our fair value estimate is 39% lower than WiseTech Global's analyst price target of US$121
Today we'll do a simple run through of a valuation method used to estimate the attractiveness of WiseTech Global Limited (ASX:WTC) as an investment opportunity by taking the expected future cash flows and discounting them to their present value. The Discounted Cash Flow (DCF) model is the tool we will apply to do this. It may sound complicated, but actually it is quite simple!
Remember though, that there are many ways to estimate a company's value, and a DCF is just one method. Anyone interested in learning a bit more about intrinsic value should have a read of the Simply Wall St analysis model.
We've found 21 US stocks that are forecast to pay a dividend yield of over 6% next year. See the full list for free.
What's The Estimated Valuation?
We use what is known as a 2-stage model, which simply means we have two different periods of growth rates for the company's cash flows. Generally the first stage is higher growth, and the second stage is a lower growth phase. To begin with, we have to get estimates of the next ten years of cash flows. Where possible we use analyst estimates, but when these aren't available we extrapolate the previous free cash flow (FCF) from the last estimate or reported value. We assume companies with shrinking free cash flow will slow their rate of shrinkage, and that companies with growing free cash flow will see their growth rate slow, over this period. We do this to reflect that growth tends to slow more in the early years than it does in later years.
A DCF is all about the idea that a dollar in the future is less valuable than a dollar today, and so the sum of these future cash flows is then discounted to today's value:
10-year free cash flow (FCF) forecast
| 2025 | 2026 | 2027 | 2028 | 2029 | 2030 | 2031 | 2032 | 2033 | 2034 | |
| Levered FCF ($, Millions) | US$165.0m | US$206.5m | US$283.1m | US$485.5m | US$613.3m | US$731.3m | US$835.8m | US$926.3m | US$1.00b | US$1.07b |
| Growth Rate Estimate Source | Analyst x6 | Analyst x6 | Analyst x6 | Analyst x1 | Est @ 26.32% | Est @ 19.24% | Est @ 14.29% | Est @ 10.83% | Est @ 8.40% | Est @ 6.70% |
| Present Value ($, Millions) Discounted @ 7.4% | US$154 | US$179 | US$228 | US$365 | US$429 | US$476 | US$507 | US$523 | US$527 | US$524 |
("Est" = FCF growth rate estimated by Simply Wall St)Present Value of 10-year Cash Flow (PVCF) = US$3.9b
We now need to calculate the Terminal Value, which accounts for all the future cash flows after this ten year period. For a number of reasons a very conservative growth rate is used that cannot exceed that of a country's GDP growth. In this case we have used the 5-year average of the 10-year government bond yield (2.7%) to estimate future growth. In the same way as with the 10-year 'growth' period, we discount future cash flows to today's value, using a cost of equity of 7.4%.
Terminal Value (TV)= FCF2034 × (1 + g) ÷ (r – g) = US$1.1b× (1 + 2.7%) ÷ (7.4%– 2.7%) = US$24b
Present Value of Terminal Value (PVTV)= TV / (1 + r)10= US$24b÷ ( 1 + 7.4%)10= US$12b
The total value, or equity value, is then the sum of the present value of the future cash flows, which in this case is US$15b. The last step is to then divide the equity value by the number of shares outstanding. Compared to the current share price of AU$85.4, the company appears around fair value at the time of writing. Remember though, that this is just an approximate valuation, and like any complex formula - garbage in, garbage out.
The Assumptions
The calculation above is very dependent on two assumptions. The first is the discount rate and the other is the cash flows. You don't have to agree with these inputs, I recommend redoing the calculations yourself and playing with them. The DCF also does not consider the possible cyclicality of an industry, or a company's future capital requirements, so it does not give a full picture of a company's potential performance. Given that we are looking at WiseTech Global as potential shareholders, the cost of equity is used as the discount rate, rather than the cost of capital (or weighted average cost of capital, WACC) which accounts for debt. In this calculation we've used 7.4%, which is based on a levered beta of 1.080. Beta is a measure of a stock's volatility, compared to the market as a whole. We get our beta from the industry average beta of globally comparable companies, with an imposed limit between 0.8 and 2.0, which is a reasonable range for a stable business.
Check out our latest analysis for WiseTech Global
SWOT Analysis for WiseTech Global
- Earnings growth over the past year exceeded the industry.
- Debt is not viewed as a risk.
- Balance sheet summary for WTC.
- Dividend is low compared to the top 25% of dividend payers in the Software market.
- Expensive based on P/E ratio and estimated fair value.
- What are analysts forecasting for WTC?
- Annual earnings are forecast to grow faster than the Australian market.
- No apparent threats visible for WTC.
Next Steps:
Whilst important, the DCF calculation shouldn't be the only metric you look at when researching a company. It's not possible to obtain a foolproof valuation with a DCF model. Instead the best use for a DCF model is to test certain assumptions and theories to see if they would lead to the company being undervalued or overvalued. If a company grows at a different rate, or if its cost of equity or risk free rate changes sharply, the output can look very different. For WiseTech Global, there are three additional factors you should further research:
- Financial Health: Does WTC have a healthy balance sheet? Take a look at our free balance sheet analysis with six simple checks on key factors like leverage and risk.
- Future Earnings: How does WTC's growth rate compare to its peers and the wider market? Dig deeper into the analyst consensus number for the upcoming years by interacting with our free analyst growth expectation chart.
- Other High Quality Alternatives: Do you like a good all-rounder? Explore our interactive list of high quality stocks to get an idea of what else is out there you may be missing!
PS. The Simply Wall St app conducts a discounted cash flow valuation for every stock on the ASX every day. If you want to find the calculation for other stocks just search here.
Valuation is complex, but we're here to simplify it.
Discover if WiseTech Global might be undervalued or overvalued with our detailed analysis, featuring fair value estimates, potential risks, dividends, insider trades, and its financial condition.
Access Free AnalysisHave feedback on this article? Concerned about the content? Get in touch with us directly. Alternatively, email editorial-team (at) simplywallst.com.This article by Simply Wall St is general in nature. We provide commentary based on historical data and analyst forecasts only using an unbiased methodology and our articles are not intended to be financial advice. It does not constitute a recommendation to buy or sell any stock, and does not take account of your objectives, or your financial situation. We aim to bring you long-term focused analysis driven by fundamental data. Note that our analysis may not factor in the latest price-sensitive company announcements or qualitative material. Simply Wall St has no position in any stocks mentioned.
Disclaimer: Investing carries risk. This is not financial advice. The above content should not be regarded as an offer, recommendation, or solicitation on acquiring or disposing of any financial products, any associated discussions, comments, or posts by author or other users should not be considered as such either. It is solely for general information purpose only, which does not consider your own investment objectives, financial situations or needs. TTM assumes no responsibility or warranty for the accuracy and completeness of the information, investors should do their own research and may seek professional advice before investing.
Most Discussed

No relevant data is available