Investing in Gen Digital (NASDAQ:GEN) five years ago would have delivered you a 64% gain
If you buy and hold a stock for many years, you'd hope to be making a profit. Better yet, you'd like to see the share price move up more than the market average. But Gen Digital Inc. (NASDAQ:GEN) has fallen short of that second goal, with a share price rise of 47% over five years, which is below the market return. On a brighter note, more newer shareholders are probably rather content with the 25% share price gain over twelve months.
With that in mind, it's worth seeing if the company's underlying fundamentals have been the driver of long term performance, or if there are some discrepancies.
This technology could replace computers: discover the 20 stocks are working to make quantum computing a reality.
There is no denying that markets are sometimes efficient, but prices do not always reflect underlying business performance. One imperfect but simple way to consider how the market perception of a company has shifted is to compare the change in the earnings per share (EPS) with the share price movement.
Over half a decade, Gen Digital managed to grow its earnings per share at 6.8% a year. So the EPS growth rate is rather close to the annualized share price gain of 8% per year. That suggests that the market sentiment around the company hasn't changed much over that time. Indeed, it would appear the share price is reacting to the EPS.
The graphic below depicts how EPS has changed over time (unveil the exact values by clicking on the image).
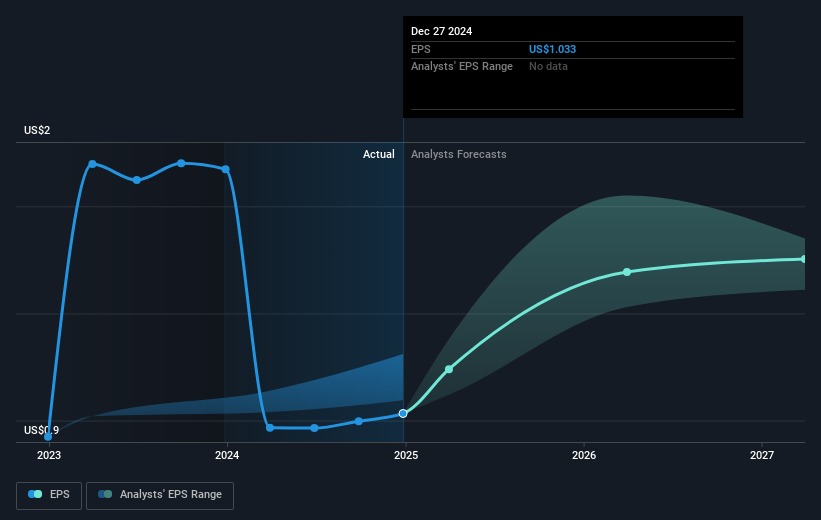
Before buying or selling a stock, we always recommend a close examination of historic growth trends, available here.
What About Dividends?
When looking at investment returns, it is important to consider the difference between total shareholder return (TSR) and share price return. The TSR is a return calculation that accounts for the value of cash dividends (assuming that any dividend received was reinvested) and the calculated value of any discounted capital raisings and spin-offs. So for companies that pay a generous dividend, the TSR is often a lot higher than the share price return. In the case of Gen Digital, it has a TSR of 64% for the last 5 years. That exceeds its share price return that we previously mentioned. The dividends paid by the company have thusly boosted the total shareholder return.
A Different Perspective
It's nice to see that Gen Digital shareholders have received a total shareholder return of 27% over the last year. And that does include the dividend. That gain is better than the annual TSR over five years, which is 10%. Therefore it seems like sentiment around the company has been positive lately. Given the share price momentum remains strong, it might be worth taking a closer look at the stock, lest you miss an opportunity. It's always interesting to track share price performance over the longer term. But to understand Gen Digital better, we need to consider many other factors. Even so, be aware that Gen Digital is showing 4 warning signs in our investment analysis , you should know about...
If you like to buy stocks alongside management, then you might just love this free list of companies. (Hint: many of them are unnoticed AND have attractive valuation).
Please note, the market returns quoted in this article reflect the market weighted average returns of stocks that currently trade on American exchanges.
New: Manage All Your Stock Portfolios in One Place
We've created the ultimate portfolio companion for stock investors, and it's free.
• Connect an unlimited number of Portfolios and see your total in one currency• Be alerted to new Warning Signs or Risks via email or mobile• Track the Fair Value of your stocks
Try a Demo Portfolio for FreeHave feedback on this article? Concerned about the content? Get in touch with us directly. Alternatively, email editorial-team (at) simplywallst.com.This article by Simply Wall St is general in nature. We provide commentary based on historical data and analyst forecasts only using an unbiased methodology and our articles are not intended to be financial advice. It does not constitute a recommendation to buy or sell any stock, and does not take account of your objectives, or your financial situation. We aim to bring you long-term focused analysis driven by fundamental data. Note that our analysis may not factor in the latest price-sensitive company announcements or qualitative material. Simply Wall St has no position in any stocks mentioned.
Disclaimer: Investing carries risk. This is not financial advice. The above content should not be regarded as an offer, recommendation, or solicitation on acquiring or disposing of any financial products, any associated discussions, comments, or posts by author or other users should not be considered as such either. It is solely for general information purpose only, which does not consider your own investment objectives, financial situations or needs. TTM assumes no responsibility or warranty for the accuracy and completeness of the information, investors should do their own research and may seek professional advice before investing.
Most Discussed
- 1
- 2
- 3
- 4
- 5
- 6
- 7
- 8
- 9
- 10