Some May Be Optimistic About Fulu Holdings' (HKG:2101) Earnings
Fulu Holdings Limited's (HKG:2101) stock was strong despite it releasing a soft earnings report last week. Our analysis suggests that investors may have noticed some promising signs beyond the statutory profit figures.
AI is about to change healthcare. These 20 stocks are working on everything from early diagnostics to drug discovery. The best part - they are all under $10bn in marketcap - there is still time to get in early.
A Closer Look At Fulu Holdings' Earnings
As finance nerds would already know, the accrual ratio from cashflow is a key measure for assessing how well a company's free cash flow (FCF) matches its profit. The accrual ratio subtracts the FCF from the profit for a given period, and divides the result by the average operating assets of the company over that time. You could think of the accrual ratio from cashflow as the 'non-FCF profit ratio'.
As a result, a negative accrual ratio is a positive for the company, and a positive accrual ratio is a negative. While it's not a problem to have a positive accrual ratio, indicating a certain level of non-cash profits, a high accrual ratio is arguably a bad thing, because it indicates paper profits are not matched by cash flow. To quote a 2014 paper by Lewellen and Resutek, "firms with higher accruals tend to be less profitable in the future".
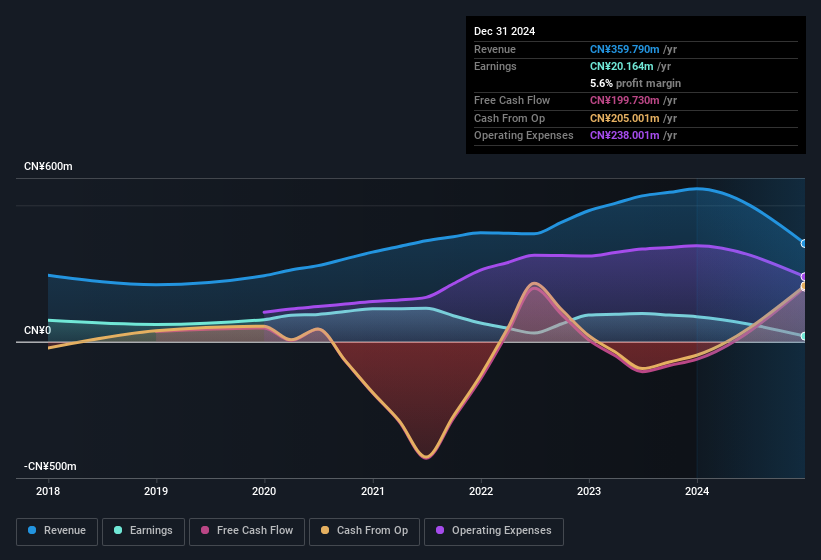
For the year to December 2024, Fulu Holdings had an accrual ratio of -0.16. That indicates that its free cash flow quite significantly exceeded its statutory profit. To wit, it produced free cash flow of CN¥200m during the period, dwarfing its reported profit of CN¥20.2m. Given that Fulu Holdings had negative free cash flow in the prior corresponding period, the trailing twelve month resul of CN¥200m would seem to be a step in the right direction.
Note: we always recommend investors check balance sheet strength. Click here to be taken to our balance sheet analysis of Fulu Holdings .
Our Take On Fulu Holdings' Profit Performance
Fulu Holdings' accrual ratio is solid, and indicates strong free cash flow, as we discussed, above. Because of this, we think Fulu Holdings' earnings potential is at least as good as it seems, and maybe even better! On the other hand, its EPS actually shrunk in the last twelve months. The goal of this article has been to assess how well we can rely on the statutory earnings to reflect the company's potential, but there is plenty more to consider. So while earnings quality is important, it's equally important to consider the risks facing Fulu Holdings at this point in time. Be aware that Fulu Holdings is showing 4 warning signs in our investment analysis and 1 of those can't be ignored...
This note has only looked at a single factor that sheds light on the nature of Fulu Holdings' profit. But there are plenty of other ways to inform your opinion of a company. For example, many people consider a high return on equity as an indication of favorable business economics, while others like to 'follow the money' and search out stocks that insiders are buying. While it might take a little research on your behalf, you may find this free collection of companies boasting high return on equity, or this list of stocks with significant insider holdings to be useful.
If you're looking to trade Fulu Holdings, open an account with the lowest-cost platform trusted by professionals, Interactive Brokers.
With clients in over 200 countries and territories, and access to 160 markets, IBKR lets you trade stocks, options, futures, forex, bonds and funds from a single integrated account.
Enjoy no hidden fees, no account minimums, and FX conversion rates as low as 0.03%, far better than what most brokers offer.
Sponsored ContentNew: AI Stock Screener & Alerts
Our new AI Stock Screener scans the market every day to uncover opportunities.
• Dividend Powerhouses (3%+ Yield)• Undervalued Small Caps with Insider Buying• High growth Tech and AI CompaniesOr build your own from over 50 metrics.
Explore Now for FreeHave feedback on this article? Concerned about the content? Get in touch with us directly. Alternatively, email editorial-team (at) simplywallst.com.This article by Simply Wall St is general in nature. We provide commentary based on historical data and analyst forecasts only using an unbiased methodology and our articles are not intended to be financial advice. It does not constitute a recommendation to buy or sell any stock, and does not take account of your objectives, or your financial situation. We aim to bring you long-term focused analysis driven by fundamental data. Note that our analysis may not factor in the latest price-sensitive company announcements or qualitative material. Simply Wall St has no position in any stocks mentioned.
Disclaimer: Investing carries risk. This is not financial advice. The above content should not be regarded as an offer, recommendation, or solicitation on acquiring or disposing of any financial products, any associated discussions, comments, or posts by author or other users should not be considered as such either. It is solely for general information purpose only, which does not consider your own investment objectives, financial situations or needs. TTM assumes no responsibility or warranty for the accuracy and completeness of the information, investors should do their own research and may seek professional advice before investing.
Most Discussed
- 1
- 2
- 3
- 4
- 5
- 6
- 7
- 8
- 9
- 10