Johns Lyng Group MD, Group CEO & Executive Director Acquires 7.2% More Stock
Investors who take an interest in Johns Lyng Group Limited (ASX:JLG) should definitely note that the MD, Group CEO & Executive Director, Scott Didier, recently paid AU$2.30 per share to buy AU$250k worth of the stock. While that's a very decent purchase to our minds, it was proportionally a bit modest, boosting their holding by just 7.2%.
Trump has pledged to "unleash" American oil and gas and these 15 US stocks have developments that are poised to benefit.
Johns Lyng Group Insider Transactions Over The Last Year
Notably, that recent purchase by MD, Group CEO & Executive Director Scott Didier was not the only time they bought Johns Lyng Group shares this year. Earlier in the year, they paid AU$3.87 per share in a AU$995k purchase. That means that an insider was happy to buy shares at above the current price of AU$2.15. While their view may have changed since the purchase was made, this does at least suggest they have had confidence in the company's future. We always take careful note of the price insiders pay when purchasing shares. As a general rule, we feel more positive about a stock if insiders have bought shares at above current prices, because that suggests they viewed the stock as good value, even at a higher price.
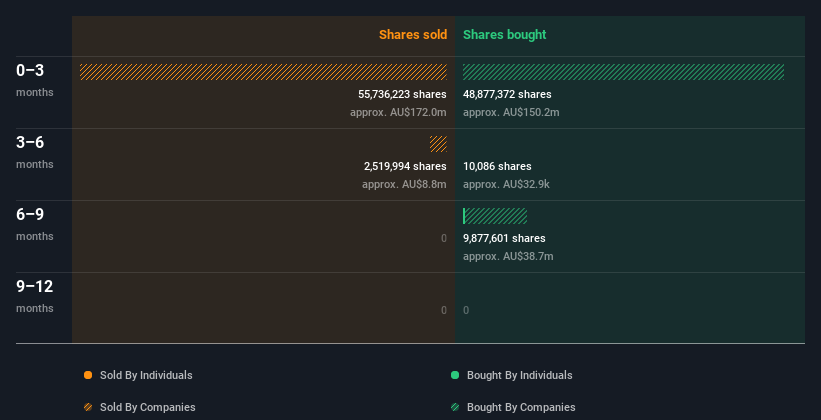
While Johns Lyng Group insiders bought shares during the last year, they didn't sell. They paid about AU$3.47 on average. This is nice to see since it implies that insiders might see value around current prices. You can see the insider transactions (by companies and individuals) over the last year depicted in the chart below. By clicking on the graph below, you can see the precise details of each insider transaction!
View our latest analysis for Johns Lyng Group

There are plenty of other companies that have insiders buying up shares. You probably do not want to miss this free list of undervalued small cap companies that insiders are buying.
Insider Ownership
Another way to test the alignment between the leaders of a company and other shareholders is to look at how many shares they own. A high insider ownership often makes company leadership more mindful of shareholder interests. It appears that Johns Lyng Group insiders own 4.0% of the company, worth about AU$24m. We've certainly seen higher levels of insider ownership elsewhere, but these holdings are enough to suggest alignment between insiders and the other shareholders.
What Might The Insider Transactions At Johns Lyng Group Tell Us?
It's certainly positive to see the recent insider purchases. We also take confidence from the longer term picture of insider transactions. When combined with notable insider ownership, these factors suggest Johns Lyng Group insiders are well aligned, and that they may think the share price is too low. So while it's helpful to know what insiders are doing in terms of buying or selling, it's also helpful to know the risks that a particular company is facing. At Simply Wall St, we found 2 warning signs for Johns Lyng Group that deserve your attention before buying any shares.
But note: Johns Lyng Group may not be the best stock to buy. So take a peek at this free list of interesting companies with high ROE and low debt.
For the purposes of this article, insiders are those individuals who report their transactions to the relevant regulatory body. We currently account for open market transactions and private dispositions of direct interests only, but not derivative transactions or indirect interests.
New: Manage All Your Stock Portfolios in One Place
We've created the ultimate portfolio companion for stock investors, and it's free.
• Connect an unlimited number of Portfolios and see your total in one currency• Be alerted to new Warning Signs or Risks via email or mobile• Track the Fair Value of your stocks
Try a Demo Portfolio for FreeHave feedback on this article? Concerned about the content? Get in touch with us directly. Alternatively, email editorial-team (at) simplywallst.com.This article by Simply Wall St is general in nature. We provide commentary based on historical data and analyst forecasts only using an unbiased methodology and our articles are not intended to be financial advice. It does not constitute a recommendation to buy or sell any stock, and does not take account of your objectives, or your financial situation. We aim to bring you long-term focused analysis driven by fundamental data. Note that our analysis may not factor in the latest price-sensitive company announcements or qualitative material. Simply Wall St has no position in any stocks mentioned.
Disclaimer: Investing carries risk. This is not financial advice. The above content should not be regarded as an offer, recommendation, or solicitation on acquiring or disposing of any financial products, any associated discussions, comments, or posts by author or other users should not be considered as such either. It is solely for general information purpose only, which does not consider your own investment objectives, financial situations or needs. TTM assumes no responsibility or warranty for the accuracy and completeness of the information, investors should do their own research and may seek professional advice before investing.
Most Discussed
- 1
- 2
- 3
- 4
- 5
- 6
- 7
- 8
- 9
- 10