Parkson Retail Asia Limited (SGX:O9E) Might Not Be As Mispriced As It Looks After Plunging 33%
The Parkson Retail Asia Limited (SGX:O9E) share price has fared very poorly over the last month, falling by a substantial 33%. Longer-term shareholders would now have taken a real hit with the stock declining 5.9% in the last year.
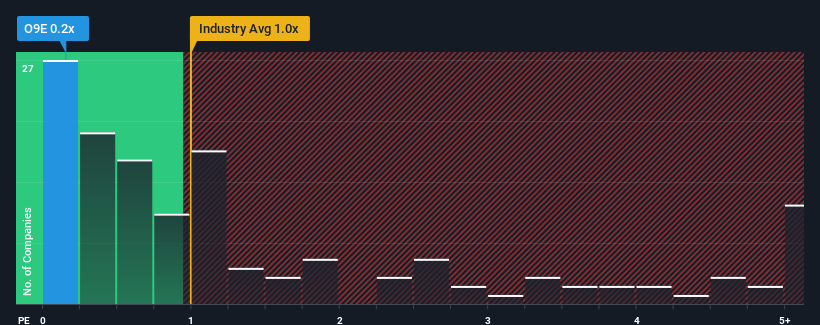
After such a large drop in price, Parkson Retail Asia may be sending buy signals at present with its price-to-sales (or "P/S") ratio of 0.2x, considering almost half of all companies in the Multiline Retail industry in Singapore have P/S ratios greater than 1x and even P/S higher than 3x aren't out of the ordinary. Although, it's not wise to just take the P/S at face value as there may be an explanation why it's limited.
We've found 21 US stocks that are forecast to pay a dividend yield of over 6% next year. See the full list for free.
See our latest analysis for Parkson Retail Asia
How Parkson Retail Asia Has Been Performing
For instance, Parkson Retail Asia's receding revenue in recent times would have to be some food for thought. It might be that many expect the disappointing revenue performance to continue or accelerate, which has repressed the P/S. If you like the company, you'd be hoping this isn't the case so that you could potentially pick up some stock while it's out of favour.
Want the full picture on earnings, revenue and cash flow for the company? Then our free report on Parkson Retail Asia will help you shine a light on its historical performance.How Is Parkson Retail Asia's Revenue Growth Trending?
The only time you'd be truly comfortable seeing a P/S as low as Parkson Retail Asia's is when the company's growth is on track to lag the industry.
Retrospectively, the last year delivered a frustrating 3.1% decrease to the company's top line. Even so, admirably revenue has lifted 50% in aggregate from three years ago, notwithstanding the last 12 months. Although it's been a bumpy ride, it's still fair to say the revenue growth recently has been more than adequate for the company.
Comparing that to the industry, which is only predicted to deliver 9.8% growth in the next 12 months, the company's momentum is stronger based on recent medium-term annualised revenue results.
In light of this, it's peculiar that Parkson Retail Asia's P/S sits below the majority of other companies. Apparently some shareholders believe the recent performance has exceeded its limits and have been accepting significantly lower selling prices.
The Final Word
Parkson Retail Asia's P/S has taken a dip along with its share price. While the price-to-sales ratio shouldn't be the defining factor in whether you buy a stock or not, it's quite a capable barometer of revenue expectations.
Our examination of Parkson Retail Asia revealed its three-year revenue trends aren't boosting its P/S anywhere near as much as we would have predicted, given they look better than current industry expectations. When we see strong revenue with faster-than-industry growth, we assume there are some significant underlying risks to the company's ability to make money which is applying downwards pressure on the P/S ratio. While recent revenue trends over the past medium-term suggest that the risk of a price decline is low, investors appear to perceive a likelihood of revenue fluctuations in the future.
Before you take the next step, you should know about the 2 warning signs for Parkson Retail Asia that we have uncovered.
If these risks are making you reconsider your opinion on Parkson Retail Asia, explore our interactive list of high quality stocks to get an idea of what else is out there.
New: Manage All Your Stock Portfolios in One Place
We've created the ultimate portfolio companion for stock investors, and it's free.
• Connect an unlimited number of Portfolios and see your total in one currency• Be alerted to new Warning Signs or Risks via email or mobile• Track the Fair Value of your stocks
Try a Demo Portfolio for FreeHave feedback on this article? Concerned about the content? Get in touch with us directly. Alternatively, email editorial-team (at) simplywallst.com.This article by Simply Wall St is general in nature. We provide commentary based on historical data and analyst forecasts only using an unbiased methodology and our articles are not intended to be financial advice. It does not constitute a recommendation to buy or sell any stock, and does not take account of your objectives, or your financial situation. We aim to bring you long-term focused analysis driven by fundamental data. Note that our analysis may not factor in the latest price-sensitive company announcements or qualitative material. Simply Wall St has no position in any stocks mentioned.
Disclaimer: Investing carries risk. This is not financial advice. The above content should not be regarded as an offer, recommendation, or solicitation on acquiring or disposing of any financial products, any associated discussions, comments, or posts by author or other users should not be considered as such either. It is solely for general information purpose only, which does not consider your own investment objectives, financial situations or needs. TTM assumes no responsibility or warranty for the accuracy and completeness of the information, investors should do their own research and may seek professional advice before investing.
Most Discussed
- 1
- 2
- 3
- 4
- 5
- 6
- 7
- 8
- 9
- 10