Endeavour Group (ASX:EDV) Takes On Some Risk With Its Use Of Debt
Warren Buffett famously said, 'Volatility is far from synonymous with risk.' It's only natural to consider a company's balance sheet when you examine how risky it is, since debt is often involved when a business collapses. Importantly, Endeavour Group Limited (ASX:EDV) does carry debt. But should shareholders be worried about its use of debt?
AI is about to change healthcare. These 20 stocks are working on everything from early diagnostics to drug discovery. The best part - they are all under $10bn in marketcap - there is still time to get in early.
What Risk Does Debt Bring?
Debt and other liabilities become risky for a business when it cannot easily fulfill those obligations, either with free cash flow or by raising capital at an attractive price. If things get really bad, the lenders can take control of the business. While that is not too common, we often do see indebted companies permanently diluting shareholders because lenders force them to raise capital at a distressed price. Having said that, the most common situation is where a company manages its debt reasonably well - and to its own advantage. When we examine debt levels, we first consider both cash and debt levels, together.
What Is Endeavour Group's Debt?
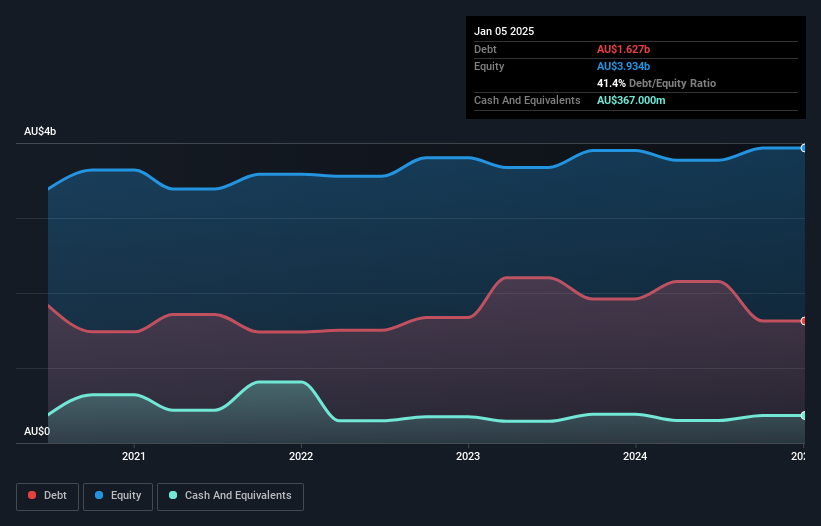
As you can see below, Endeavour Group had AU$1.63b of debt at January 2025, down from AU$1.92b a year prior. However, because it has a cash reserve of AU$367.0m, its net debt is less, at about AU$1.26b.
How Healthy Is Endeavour Group's Balance Sheet?
According to the last reported balance sheet, Endeavour Group had liabilities of AU$2.39b due within 12 months, and liabilities of AU$5.45b due beyond 12 months. Offsetting these obligations, it had cash of AU$367.0m as well as receivables valued at AU$189.0m due within 12 months. So it has liabilities totalling AU$7.28b more than its cash and near-term receivables, combined.
Given this deficit is actually higher than the company's market capitalization of AU$7.16b, we think shareholders really should watch Endeavour Group's debt levels, like a parent watching their child ride a bike for the first time. In the scenario where the company had to clean up its balance sheet quickly, it seems likely shareholders would suffer extensive dilution.
Check out our latest analysis for Endeavour Group
We measure a company's debt load relative to its earnings power by looking at its net debt divided by its earnings before interest, tax, depreciation, and amortization (EBITDA) and by calculating how easily its earnings before interest and tax (EBIT) cover its interest expense (interest cover). This way, we consider both the absolute quantum of the debt, as well as the interest rates paid on it.
While Endeavour Group's low debt to EBITDA ratio of 1.0 suggests only modest use of debt, the fact that EBIT only covered the interest expense by 3.2 times last year does give us pause. But the interest payments are certainly sufficient to have us thinking about how affordable its debt is. Sadly, Endeavour Group's EBIT actually dropped 4.9% in the last year. If earnings continue on that decline then managing that debt will be difficult like delivering hot soup on a unicycle. There's no doubt that we learn most about debt from the balance sheet. But ultimately the future profitability of the business will decide if Endeavour Group can strengthen its balance sheet over time. So if you're focused on the future you can check out this free report showing analyst profit forecasts .
Finally, while the tax-man may adore accounting profits, lenders only accept cold hard cash. So the logical step is to look at the proportion of that EBIT that is matched by actual free cash flow. During the last three years, Endeavour Group produced sturdy free cash flow equating to 63% of its EBIT, about what we'd expect. This free cash flow puts the company in a good position to pay down debt, when appropriate.
Our View
While Endeavour Group's interest cover makes us cautious about it, its track record of staying on top of its total liabilities is no better. But its not so bad at converting EBIT to free cash flow. When we consider all the factors discussed, it seems to us that Endeavour Group is taking some risks with its use of debt. So while that leverage does boost returns on equity, we wouldn't really want to see it increase from here. The balance sheet is clearly the area to focus on when you are analysing debt. However, not all investment risk resides within the balance sheet - far from it. For example, we've discovered 1 warning sign for Endeavour Group that you should be aware of before investing here.
At the end of the day, it's often better to focus on companies that are free from net debt. You can access our special list of such companies (all with a track record of profit growth). It's free.
If you're looking to trade Endeavour Group, open an account with the lowest-cost platform trusted by professionals, Interactive Brokers.
With clients in over 200 countries and territories, and access to 160 markets, IBKR lets you trade stocks, options, futures, forex, bonds and funds from a single integrated account.
Enjoy no hidden fees, no account minimums, and FX conversion rates as low as 0.03%, far better than what most brokers offer.
Sponsored ContentValuation is complex, but we're here to simplify it.
Discover if Endeavour Group might be undervalued or overvalued with our detailed analysis, featuring fair value estimates, potential risks, dividends, insider trades, and its financial condition.
Access Free AnalysisHave feedback on this article? Concerned about the content? Get in touch with us directly. Alternatively, email editorial-team (at) simplywallst.com.This article by Simply Wall St is general in nature. We provide commentary based on historical data and analyst forecasts only using an unbiased methodology and our articles are not intended to be financial advice. It does not constitute a recommendation to buy or sell any stock, and does not take account of your objectives, or your financial situation. We aim to bring you long-term focused analysis driven by fundamental data. Note that our analysis may not factor in the latest price-sensitive company announcements or qualitative material. Simply Wall St has no position in any stocks mentioned.
Disclaimer: Investing carries risk. This is not financial advice. The above content should not be regarded as an offer, recommendation, or solicitation on acquiring or disposing of any financial products, any associated discussions, comments, or posts by author or other users should not be considered as such either. It is solely for general information purpose only, which does not consider your own investment objectives, financial situations or needs. TTM assumes no responsibility or warranty for the accuracy and completeness of the information, investors should do their own research and may seek professional advice before investing.
Most Discussed
- 1
- 2
- 3
- 4
- 5
- 6
- 7
- 8
- 9
- 10