Impressive Earnings May Not Tell The Whole Story For YesAsia Holdings (HKG:2209)
Despite announcing strong earnings, YesAsia Holdings Limited's (HKG:2209) stock was sluggish. We did some digging and found some worrying underlying problems.
Trump has pledged to "unleash" American oil and gas and these 15 US stocks have developments that are poised to benefit.
A Closer Look At YesAsia Holdings' Earnings
As finance nerds would already know, the accrual ratio from cashflow is a key measure for assessing how well a company's free cash flow (FCF) matches its profit. The accrual ratio subtracts the FCF from the profit for a given period, and divides the result by the average operating assets of the company over that time. You could think of the accrual ratio from cashflow as the 'non-FCF profit ratio'.
As a result, a negative accrual ratio is a positive for the company, and a positive accrual ratio is a negative. While having an accrual ratio above zero is of little concern, we do think it's worth noting when a company has a relatively high accrual ratio. That's because some academic studies have suggested that high accruals ratios tend to lead to lower profit or less profit growth.
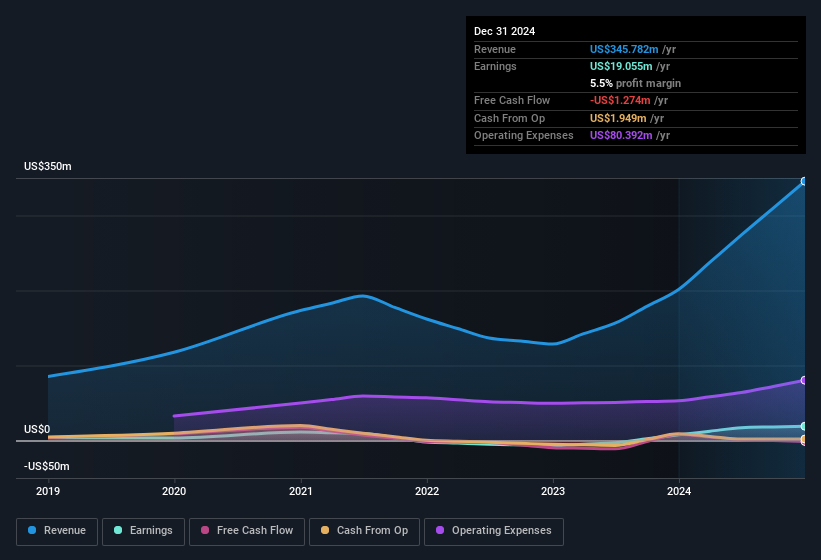
YesAsia Holdings has an accrual ratio of 0.86 for the year to December 2024. Statistically speaking, that's a real negative for future earnings. And indeed, during the period the company didn't produce any free cash flow whatsoever. Even though it reported a profit of US$19.1m, a look at free cash flow indicates it actually burnt through US$1.3m in the last year. We saw that FCF was US$8.2m a year ago though, so YesAsia Holdings has at least been able to generate positive FCF in the past. The good news for shareholders is that YesAsia Holdings' accrual ratio was much better last year, so this year's poor reading might simply be a case of a short term mismatch between profit and FCF. Shareholders should look for improved cashflow relative to profit in the current year, if that is indeed the case.
That might leave you wondering what analysts are forecasting in terms of future profitability. Luckily, you can click here to see an interactive graph depicting future profitability, based on their estimates.
Our Take On YesAsia Holdings' Profit Performance
As we have made quite clear, we're a bit worried that YesAsia Holdings didn't back up the last year's profit with free cashflow. As a result, we think it may well be the case that YesAsia Holdings' underlying earnings power is lower than its statutory profit. The silver lining is that its EPS growth over the last year has been really wonderful, even if it's not a perfect measure. At the end of the day, it's essential to consider more than just the factors above, if you want to understand the company properly. So while earnings quality is important, it's equally important to consider the risks facing YesAsia Holdings at this point in time. To help with this, we've discovered 3 warning signs (1 doesn't sit too well with us!) that you ought to be aware of before buying any shares in YesAsia Holdings.
This note has only looked at a single factor that sheds light on the nature of YesAsia Holdings' profit. But there are plenty of other ways to inform your opinion of a company. Some people consider a high return on equity to be a good sign of a quality business. While it might take a little research on your behalf, you may find this free collection of companies boasting high return on equity, or this list of stocks with significant insider holdings to be useful.
New: Manage All Your Stock Portfolios in One Place
We've created the ultimate portfolio companion for stock investors, and it's free.
• Connect an unlimited number of Portfolios and see your total in one currency• Be alerted to new Warning Signs or Risks via email or mobile• Track the Fair Value of your stocks
Try a Demo Portfolio for FreeHave feedback on this article? Concerned about the content? Get in touch with us directly. Alternatively, email editorial-team (at) simplywallst.com.This article by Simply Wall St is general in nature. We provide commentary based on historical data and analyst forecasts only using an unbiased methodology and our articles are not intended to be financial advice. It does not constitute a recommendation to buy or sell any stock, and does not take account of your objectives, or your financial situation. We aim to bring you long-term focused analysis driven by fundamental data. Note that our analysis may not factor in the latest price-sensitive company announcements or qualitative material. Simply Wall St has no position in any stocks mentioned.
Disclaimer: Investing carries risk. This is not financial advice. The above content should not be regarded as an offer, recommendation, or solicitation on acquiring or disposing of any financial products, any associated discussions, comments, or posts by author or other users should not be considered as such either. It is solely for general information purpose only, which does not consider your own investment objectives, financial situations or needs. TTM assumes no responsibility or warranty for the accuracy and completeness of the information, investors should do their own research and may seek professional advice before investing.
Most Discussed
- 1
- 2
- 3
- 4
- 5
- 6
- 7
- 8
- 9
- 10