ASX Penny Stocks Spotlight: Helios Energy And 2 Other Promising Picks
As Australian shares brace for a significant downturn, with the ASX 200 futures indicating a 1.4% drop, investors are keenly observing how global trade tensions might impact market stability. In such volatile times, identifying stocks with strong financial health becomes crucial for those seeking growth opportunities. Penny stocks, despite their somewhat outdated label, continue to offer potential value in smaller or newer companies that may be poised for long-term success.
Top 10 Penny Stocks In Australia
| Name | Share Price | Market Cap | Rewards & Risks |
| CTI Logistics (ASX:CLX) | A$1.55 | A$120.92M | ✅ 4 ⚠️ 2 View Analysis > |
| EZZ Life Science Holdings (ASX:EZZ) | A$1.46 | A$68.87M | ✅ 4 ⚠️ 2 View Analysis > |
| IVE Group (ASX:IGL) | A$2.32 | A$358.42M | ✅ 4 ⚠️ 2 View Analysis > |
| GTN (ASX:GTN) | A$0.60 | A$117.83M | ✅ 3 ⚠️ 2 View Analysis > |
| West African Resources (ASX:WAF) | A$2.26 | A$2.58B | ✅ 4 ⚠️ 1 View Analysis > |
| Bisalloy Steel Group (ASX:BIS) | A$3.00 | A$142.35M | ✅ 3 ⚠️ 2 View Analysis > |
| Regal Partners (ASX:RPL) | A$1.975 | A$662.41M | ✅ 5 ⚠️ 3 View Analysis > |
| SHAPE Australia (ASX:SHA) | A$2.92 | A$241.6M | ✅ 3 ⚠️ 1 View Analysis > |
| NRW Holdings (ASX:NWH) | A$2.60 | A$1.19B | ✅ 5 ⚠️ 1 View Analysis > |
| LaserBond (ASX:LBL) | A$0.385 | A$45.17M | ✅ 3 ⚠️ 2 View Analysis > |
Click here to see the full list of 976 stocks from our ASX Penny Stocks screener.
Let's explore several standout options from the results in the screener.
Helios Energy (ASX:HE8)
Simply Wall St Financial Health Rating: ★★★★☆☆
Overview: Helios Energy Limited is an onshore oil and gas exploration company operating in the United States with a market cap of A$32.96 million.
Operations: The company's revenue is derived entirely from its oil and gas exploration activities, amounting to A$0.08 million.
Market Cap: A$32.96M
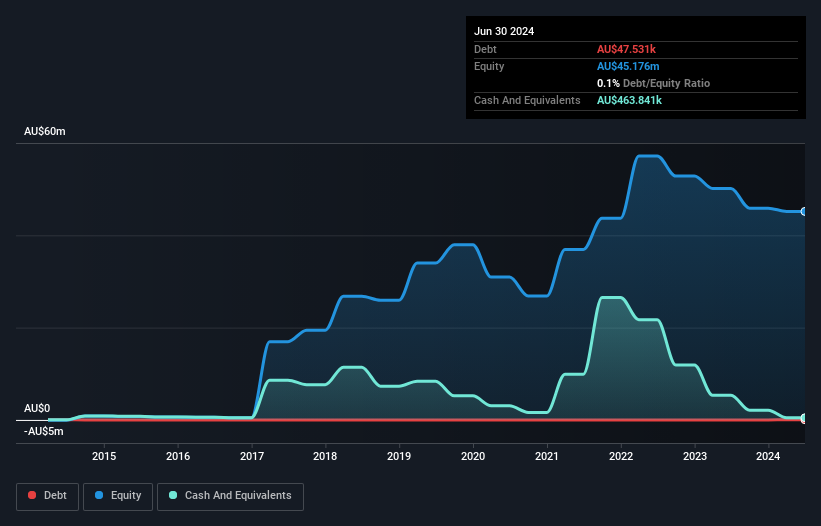
Helios Energy Limited, an onshore oil and gas exploration company, remains pre-revenue with recent sales of A$0.018 million. Despite having more cash than debt and reducing losses at 3.2% annually over five years, the company faces challenges with high volatility and unprofitability. Recent follow-on equity offerings totaling A$3.6 million aim to bolster its financial position amid a negative return on equity of -7.37%. The company's short-term assets cover long-term liabilities but fall short for short-term obligations, highlighting liquidity concerns despite new capital raised through private placements and convertible notes issuance.
- Navigate through the intricacies of Helios Energy with our comprehensive balance sheet health report here.
- Learn about Helios Energy's historical performance here.
K&S (ASX:KSC)
Simply Wall St Financial Health Rating: ★★★★☆☆
Overview: K&S Corporation Limited operates in the transportation and logistics, warehousing, and fuel distribution sectors across Australia and New Zealand, with a market cap of A$484.45 million.
Operations: The company's revenue is primarily derived from Australian Transport (A$553.12 million), Fuel (A$213.29 million), and New Zealand Transport (A$74.99 million).
Market Cap: A$484.45M
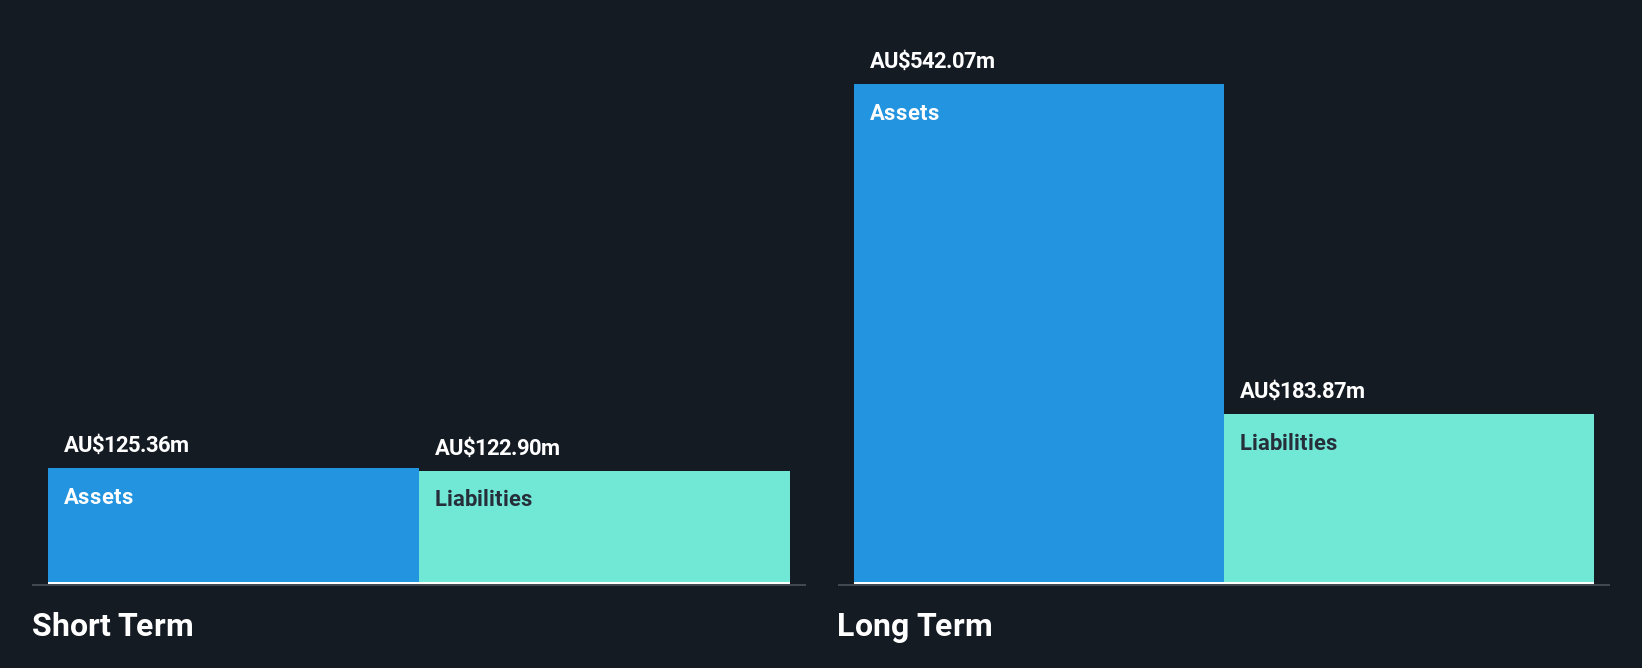
K&S Corporation Limited, with a market cap of A$484.45 million, operates in transportation and logistics across Australia and New Zealand. The company has demonstrated stable earnings growth of 25.5% annually over the past five years, though recent growth slowed to 2.8%. Its net debt to equity ratio is satisfactory at 12.7%, with debt well-covered by operating cash flow (86.7%). However, short-term assets (A$125.4M) do not cover long-term liabilities (A$183.9M). Recent announcements include a share buyback program and decreased dividend payouts, reflecting strategic financial management amid fluctuating revenue streams and modest profit margins of 3.9%.
- Jump into the full analysis health report here for a deeper understanding of K&S.
- Explore historical data to track K&S' performance over time in our past results report.
Urbanise.com (ASX:UBN)
Simply Wall St Financial Health Rating: ★★★★★☆
Overview: Urbanise.com Limited designs and develops cloud-based software platforms for the strata and facilities management industries across multiple regions, with a market cap of A$41.93 million.
Operations: The company's revenue is derived from three main segments: Africa (A$0.09 million), Europe and Middle East (E/ME) (A$3.47 million), and Australia, New Zealand and Asia (APAC) (A$9.08 million).
Market Cap: A$41.93M
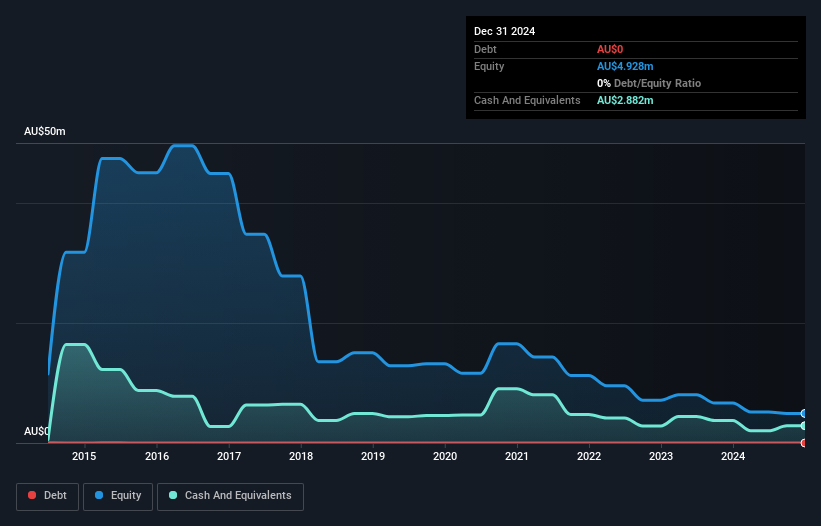
Urbanise.com Limited, with a market cap of A$41.93 million, operates cloud-based software platforms across regions including APAC and E/ME. Despite being unprofitable, its revenue for the half-year ended December 31, 2024 was A$6.31 million, slightly down from the previous year. The company is debt-free and has a cash runway exceeding three years based on current free cash flow stability. However, short-term assets of A$5.7 million fall short of covering liabilities at A$7.3 million, posing liquidity challenges despite having an experienced board and stable weekly volatility at 10%.
- Unlock comprehensive insights into our analysis of Urbanise.com stock in this financial health report.
- Gain insights into Urbanise.com's past trends and performance with our report on the company's historical track record.
Key Takeaways
- Dive into all 976 of the ASX Penny Stocks we have identified here.
- Searching for a Fresh Perspective? The end of cancer? These 21 emerging AI stocks are developing tech that will allow early idenification of life changing disesaes like cancer and Alzheimer's.
This article by Simply Wall St is general in nature. We provide commentary based on historical data and analyst forecasts only using an unbiased methodology and our articles are not intended to be financial advice. It does not constitute a recommendation to buy or sell any stock, and does not take account of your objectives, or your financial situation. We aim to bring you long-term focused analysis driven by fundamental data. Note that our analysis may not factor in the latest price-sensitive company announcements or qualitative material. Simply Wall St has no position in any stocks mentioned.
If you're looking to trade Helios Energy, open an account with the lowest-cost platform trusted by professionals, Interactive Brokers.
With clients in over 200 countries and territories, and access to 160 markets, IBKR lets you trade stocks, options, futures, forex, bonds and funds from a single integrated account.
Enjoy no hidden fees, no account minimums, and FX conversion rates as low as 0.03%, far better than what most brokers offer.
Sponsored ContentValuation is complex, but we're here to simplify it.
Discover if Helios Energy might be undervalued or overvalued with our detailed analysis, featuring fair value estimates, potential risks, dividends, insider trades, and its financial condition.
Access Free AnalysisHave feedback on this article? Concerned about the content? Get in touch with us directly. Alternatively, email editorial-team@simplywallst.com
Disclaimer: Investing carries risk. This is not financial advice. The above content should not be regarded as an offer, recommendation, or solicitation on acquiring or disposing of any financial products, any associated discussions, comments, or posts by author or other users should not be considered as such either. It is solely for general information purpose only, which does not consider your own investment objectives, financial situations or needs. TTM assumes no responsibility or warranty for the accuracy and completeness of the information, investors should do their own research and may seek professional advice before investing.
Most Discussed
- 1
- 2
- 3
- 4
- 5
- 6
- 7
- 8
- 9
- 10