SJM Holdings Limited's (HKG:880) Business Is Yet to Catch Up With Its Share Price
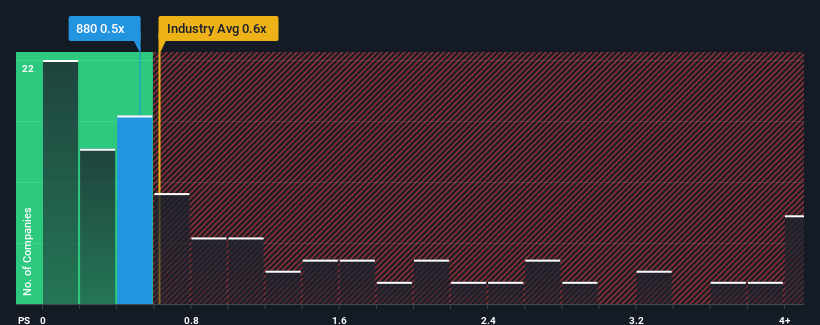
There wouldn't be many who think SJM Holdings Limited's (HKG:880) price-to-sales (or "P/S") ratio of 0.5x is worth a mention when the median P/S for the Hospitality industry in Hong Kong is similar at about 0.6x. While this might not raise any eyebrows, if the P/S ratio is not justified investors could be missing out on a potential opportunity or ignoring looming disappointment.
Trump has pledged to "unleash" American oil and gas and these 15 US stocks have developments that are poised to benefit.
View our latest analysis for SJM Holdings
What Does SJM Holdings' P/S Mean For Shareholders?
With revenue growth that's superior to most other companies of late, SJM Holdings has been doing relatively well. It might be that many expect the strong revenue performance to wane, which has kept the P/S ratio from rising. If not, then existing shareholders have reason to be feeling optimistic about the future direction of the share price.
Keen to find out how analysts think SJM Holdings' future stacks up against the industry? In that case, our free report is a great place to start .What Are Revenue Growth Metrics Telling Us About The P/S?
The only time you'd be comfortable seeing a P/S like SJM Holdings' is when the company's growth is tracking the industry closely.
Retrospectively, the last year delivered an exceptional 33% gain to the company's top line. The latest three year period has also seen an excellent 186% overall rise in revenue, aided by its short-term performance. So we can start by confirming that the company has done a great job of growing revenue over that time.
Looking ahead now, revenue is anticipated to climb by 5.2% per year during the coming three years according to the twelve analysts following the company. With the industry predicted to deliver 14% growth per year, the company is positioned for a weaker revenue result.
With this information, we find it interesting that SJM Holdings is trading at a fairly similar P/S compared to the industry. It seems most investors are ignoring the fairly limited growth expectations and are willing to pay up for exposure to the stock. These shareholders may be setting themselves up for future disappointment if the P/S falls to levels more in line with the growth outlook.
The Final Word
Using the price-to-sales ratio alone to determine if you should sell your stock isn't sensible, however it can be a practical guide to the company's future prospects.
When you consider that SJM Holdings' revenue growth estimates are fairly muted compared to the broader industry, it's easy to see why we consider it unexpected to be trading at its current P/S ratio. When we see companies with a relatively weaker revenue outlook compared to the industry, we suspect the share price is at risk of declining, sending the moderate P/S lower. A positive change is needed in order to justify the current price-to-sales ratio.
Before you take the next step, you should know about the 1 warning sign for SJM Holdings that we have uncovered.
It's important to make sure you look for a great company, not just the first idea you come across. So if growing profitability aligns with your idea of a great company, take a peek at this free list of interesting companies with strong recent earnings growth (and a low P/E).
New: Manage All Your Stock Portfolios in One Place
We've created the ultimate portfolio companion for stock investors, and it's free.
• Connect an unlimited number of Portfolios and see your total in one currency• Be alerted to new Warning Signs or Risks via email or mobile• Track the Fair Value of your stocks
Try a Demo Portfolio for FreeHave feedback on this article? Concerned about the content? Get in touch with us directly. Alternatively, email editorial-team (at) simplywallst.com.This article by Simply Wall St is general in nature. We provide commentary based on historical data and analyst forecasts only using an unbiased methodology and our articles are not intended to be financial advice. It does not constitute a recommendation to buy or sell any stock, and does not take account of your objectives, or your financial situation. We aim to bring you long-term focused analysis driven by fundamental data. Note that our analysis may not factor in the latest price-sensitive company announcements or qualitative material. Simply Wall St has no position in any stocks mentioned.
Disclaimer: Investing carries risk. This is not financial advice. The above content should not be regarded as an offer, recommendation, or solicitation on acquiring or disposing of any financial products, any associated discussions, comments, or posts by author or other users should not be considered as such either. It is solely for general information purpose only, which does not consider your own investment objectives, financial situations or needs. TTM assumes no responsibility or warranty for the accuracy and completeness of the information, investors should do their own research and may seek professional advice before investing.
Most Discussed
- 1
- 2
- 3
- 4
- 5
- 6
- 7
- 8
- 9
- 10