Olam Group Full Year 2024 Earnings: EPS: S$0.014 (vs S$0.065 in FY 2023)
Olam Group (SGX:VC2) Full Year 2024 Results
Key Financial Results
- Revenue: S$56.3b (up 16% from FY 2023).
- Net income: S$53.8m (down 78% from FY 2023).
- Profit margin: 0.1% (down from 0.5% in FY 2023).
- EPS: S$0.014 (down from S$0.065 in FY 2023).
AI is about to change healthcare. These 20 stocks are working on everything from early diagnostics to drug discovery. The best part - they are all under $10bn in marketcap - there is still time to get in early.
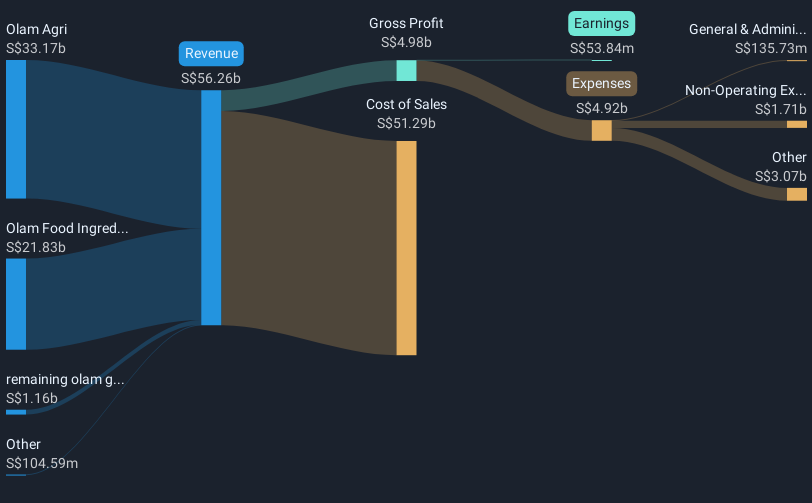
All figures shown in the chart above are for the trailing 12 month (TTM) period
The primary driver behind last 12 months revenue was the Olam Agri segment contributing a total revenue of S$33.2b (59% of total revenue). Notably, cost of sales worth S$51.3b amounted to 91% of total revenue thereby underscoring the impact on earnings. Explore how VC2's revenue and expenses shape its earnings.
Olam Group shares are down 11% from a week ago.
Risk Analysis
What about risks? Every company has them, and we've spotted 5 warning signs for Olam Group (of which 4 are a bit unpleasant!) you should know about.
New: AI Stock Screener & Alerts
Our new AI Stock Screener scans the market every day to uncover opportunities.
• Dividend Powerhouses (3%+ Yield)• Undervalued Small Caps with Insider Buying• High growth Tech and AI CompaniesOr build your own from over 50 metrics.
Explore Now for FreeHave feedback on this article? Concerned about the content? Get in touch with us directly. Alternatively, email editorial-team (at) simplywallst.com.This article by Simply Wall St is general in nature. We provide commentary based on historical data and analyst forecasts only using an unbiased methodology and our articles are not intended to be financial advice. It does not constitute a recommendation to buy or sell any stock, and does not take account of your objectives, or your financial situation. We aim to bring you long-term focused analysis driven by fundamental data. Note that our analysis may not factor in the latest price-sensitive company announcements or qualitative material. Simply Wall St has no position in any stocks mentioned.
Disclaimer: Investing carries risk. This is not financial advice. The above content should not be regarded as an offer, recommendation, or solicitation on acquiring or disposing of any financial products, any associated discussions, comments, or posts by author or other users should not be considered as such either. It is solely for general information purpose only, which does not consider your own investment objectives, financial situations or needs. TTM assumes no responsibility or warranty for the accuracy and completeness of the information, investors should do their own research and may seek professional advice before investing.
Most Discussed
- 1
- 2
- 3
- 4
- 5
- 6
- 7
- 8
- 9
- 10