April 2025 Asian Penny Stocks To Consider
Amidst heightened global trade tensions and economic uncertainty, Asian markets have been navigating a challenging landscape. Despite these headwinds, the allure of penny stocks remains significant for investors seeking unique opportunities in smaller or newer companies. While the term 'penny stocks' might seem outdated, their potential for growth is undeniable when backed by strong financials; let's examine several such stocks that stand out for their financial strength.
Top 10 Penny Stocks In Asia
| Name | Share Price | Market Cap | Rewards & Risks |
| Rojana Industrial Park (SET:ROJNA) | THB4.96 | THB10.02B | ✅ 3 ⚠️ 3 View Analysis > |
| Interlink Telecom (SET:ITEL) | THB1.22 | THB1.69B | ✅ 4 ⚠️ 5 View Analysis > |
| CNMC Goldmine Holdings (Catalist:5TP) | SGD0.345 | SGD139.82M | ✅ 4 ⚠️ 1 View Analysis > |
| Beng Kuang Marine (SGX:BEZ) | SGD0.175 | SGD34.86M | ✅ 4 ⚠️ 3 View Analysis > |
| Yangzijiang Shipbuilding (Holdings) (SGX:BS6) | SGD1.94 | SGD7.65B | ✅ 5 ⚠️ 0 View Analysis > |
| YesAsia Holdings (SEHK:2209) | HK$2.80 | HK$1.15B | ✅ 4 ⚠️ 3 View Analysis > |
| Bosideng International Holdings (SEHK:3998) | HK$3.94 | HK$45.13B | ✅ 4 ⚠️ 1 View Analysis > |
| Lever Style (SEHK:1346) | HK$1.17 | HK$738.21M | ✅ 4 ⚠️ 2 View Analysis > |
| Goodbaby International Holdings (SEHK:1086) | HK$1.09 | HK$1.82B | ✅ 4 ⚠️ 2 View Analysis > |
| Xiamen Hexing Packaging Printing (SZSE:002228) | CN¥2.87 | CN¥3.32B | ✅ 3 ⚠️ 1 View Analysis > |
Click here to see the full list of 1,165 stocks from our Asian Penny Stocks screener.
We're going to check out a few of the best picks from our screener tool.
Nickel Asia (PSE:NIKL)
Simply Wall St Financial Health Rating: ★★★★★☆
Overview: Nickel Asia Corporation operates in the Philippines, focusing on mining and exploring nickel saprolite, limonite ore, limestone, and quarry materials, with a market cap of ₱31.76 billion.
Operations: The company's revenue is primarily derived from its mining operations, with significant contributions from TMC at ₱8.82 billion, RTN at ₱4.89 billion, CMC at ₱2.65 billion, HMC at ₱2.53 billion, and DMC at ₱870.17 million; supplemented by power generation through EPI and NAC totaling ₱1.34 billion and services provided by RTN/TMC/CDTN amounting to ₱1.27 billion.
Market Cap: ₱31.76B
Nickel Asia Corporation, with a market cap of ₱31.76 billion, faces challenges as its earnings have declined significantly, with net income dropping from ₱3.75 billion to ₱1.52 billion year-over-year. Despite stable weekly volatility and no shareholder dilution over the past year, the company's profit margins have decreased to 7.1%. The recent Memorandum of Understanding with DMCI Mining Corporation aims to enhance nickel processing capabilities in the Philippines but remains in exploratory stages. Additionally, Nickel Asia's dividend yield is not well covered by free cash flows and has been reduced recently amidst declining revenues and earnings pressures.
- Dive into the specifics of Nickel Asia here with our thorough balance sheet health report.
- Learn about Nickel Asia's future growth trajectory here.
V.S. International Group (SEHK:1002)
Simply Wall St Financial Health Rating: ★★★★☆☆
Overview: V.S. International Group Limited is an investment holding company that manufactures, assembles, and sells plastic molded products and parts, with a market cap of HK$173.26 million.
Operations: The company's revenue is derived from several regions, with Mainland China contributing CN¥26.75 billion, the United States of America CN¥113.13 million, South East Asia CN¥18.85 million, Europe CN¥9.59 million, and Hong Kong CN¥0.50 million.
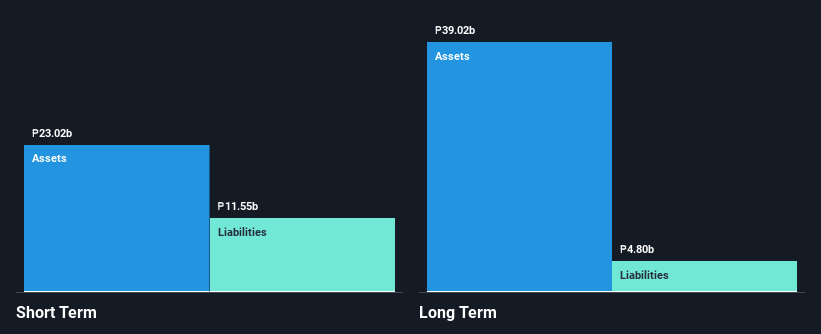
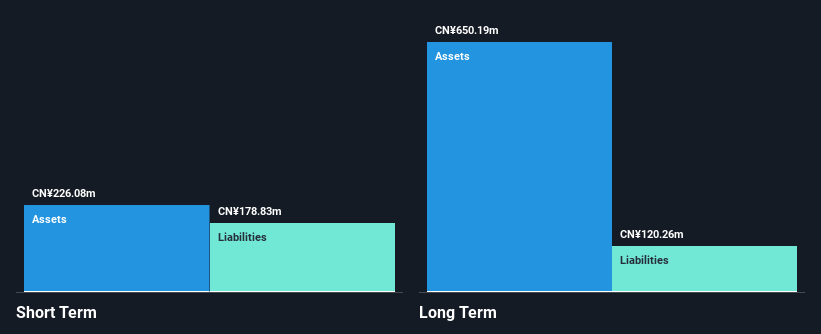
Market Cap: HK$173.26M
V.S. International Group Limited, with a market cap of HK$173.26 million, is navigating the penny stock landscape with strategic moves and financial adjustments. The company has reduced its debt to equity ratio from 50.4% to 17% over five years, indicating improved financial health despite being unprofitable. Its short-term assets (CN¥226.1M) cover both short and long-term liabilities, providing some stability amidst volatility higher than most Hong Kong stocks. Recent developments include an extended MOU with Mega Fortris Berhad for potential collaboration in Macao's playing card security solutions sector, highlighting efforts to explore new revenue streams while reducing losses annually by 25.7%.
- Click here and access our complete financial health analysis report to understand the dynamics of V.S. International Group.
- Gain insights into V.S. International Group's past trends and performance with our report on the company's historical track record.
CHYY Development Group (SEHK:8128)
Simply Wall St Financial Health Rating: ★★★★★☆
Overview: CHYY Development Group Limited focuses on the research, development, and promotion of geothermal energy for building heating applications in Mainland China, with a market cap of HK$171.17 million.
Operations: The company's revenue is primarily derived from its Property Investment and Development segment, which generated HK$11.98 million, followed by Shallow Geothermal Energy (excluding air conditioning and shallow geothermal heat pumps) at HK$62.92 million, and the Air Conditioning/Shallow Geothermal Heat Pump segment contributing HK$0.71 million.
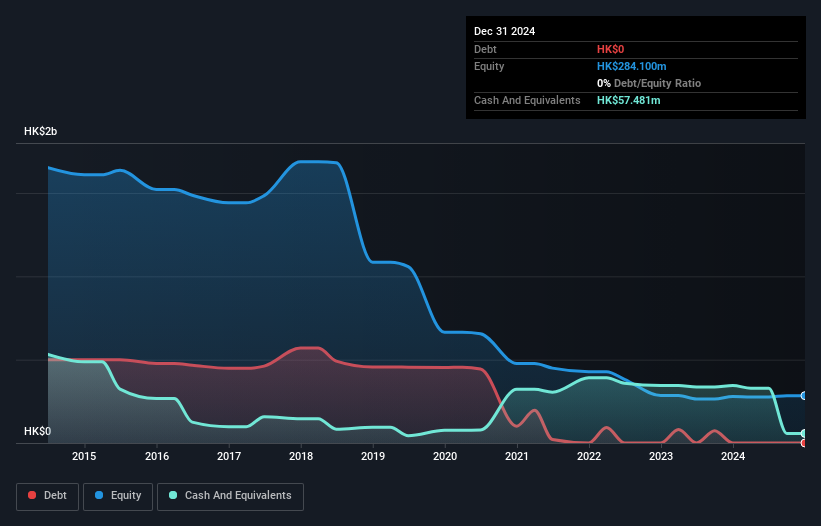
Market Cap: HK$171.17M
CHYY Development Group, with a market cap of HK$171.17 million, has shown significant earnings growth over the past five years, becoming profitable and growing earnings by 54.1% annually. The company is debt-free and its short-term assets exceed long-term liabilities, although they fall short of covering all short-term liabilities. Despite high volatility in its share price and a low return on equity at 4%, CHYY's recent board changes could bring fresh strategic insights with Mr. Guo Guanglei's extensive leadership experience potentially steering future growth in geothermal energy applications across China.
- Unlock comprehensive insights into our analysis of CHYY Development Group stock in this financial health report.
- Explore historical data to track CHYY Development Group's performance over time in our past results report.
Next Steps
- Unlock our comprehensive list of 1,165 Asian Penny Stocks by clicking here.
- Interested In Other Possibilities? Rare earth metals are the new gold rush. Find out which 20 stocks are leading the charge.
This article by Simply Wall St is general in nature. We provide commentary based on historical data and analyst forecasts only using an unbiased methodology and our articles are not intended to be financial advice. It does not constitute a recommendation to buy or sell any stock, and does not take account of your objectives, or your financial situation. We aim to bring you long-term focused analysis driven by fundamental data. Note that our analysis may not factor in the latest price-sensitive company announcements or qualitative material. Simply Wall St has no position in any stocks mentioned.
New: AI Stock Screener & Alerts
Our new AI Stock Screener scans the market every day to uncover opportunities.
• Dividend Powerhouses (3%+ Yield)• Undervalued Small Caps with Insider Buying• High growth Tech and AI CompaniesOr build your own from over 50 metrics.
Explore Now for FreeHave feedback on this article? Concerned about the content? Get in touch with us directly. Alternatively, email editorial-team@simplywallst.com
Disclaimer: Investing carries risk. This is not financial advice. The above content should not be regarded as an offer, recommendation, or solicitation on acquiring or disposing of any financial products, any associated discussions, comments, or posts by author or other users should not be considered as such either. It is solely for general information purpose only, which does not consider your own investment objectives, financial situations or needs. TTM assumes no responsibility or warranty for the accuracy and completeness of the information, investors should do their own research and may seek professional advice before investing.
Most Discussed
- 1
- 2
- 3
- 4
- 5
- 6
- 7
- 8
- 9
- 10