Investors five-year losses continue as Emeco Holdings (ASX:EHL) dips a further 12% this week, earnings continue to decline
Ideally, your overall portfolio should beat the market average. But in any portfolio, there will be mixed results between individual stocks. At this point some shareholders may be questioning their investment in Emeco Holdings Limited (ASX:EHL), since the last five years saw the share price fall 35%. Unfortunately the share price momentum is still quite negative, with prices down 17% in thirty days.
Given the past week has been tough on shareholders, let's investigate the fundamentals and see what we can learn.
Trump has pledged to "unleash" American oil and gas and these 15 US stocks have developments that are poised to benefit.
While markets are a powerful pricing mechanism, share prices reflect investor sentiment, not just underlying business performance. One way to examine how market sentiment has changed over time is to look at the interaction between a company's share price and its earnings per share (EPS).
During the five years over which the share price declined, Emeco Holdings' earnings per share (EPS) dropped by 4.3% each year. This reduction in EPS is less than the 8% annual reduction in the share price. So it seems the market was too confident about the business, in the past. The less favorable sentiment is reflected in its current P/E ratio of 5.62.
The image below shows how EPS has tracked over time (if you click on the image you can see greater detail).
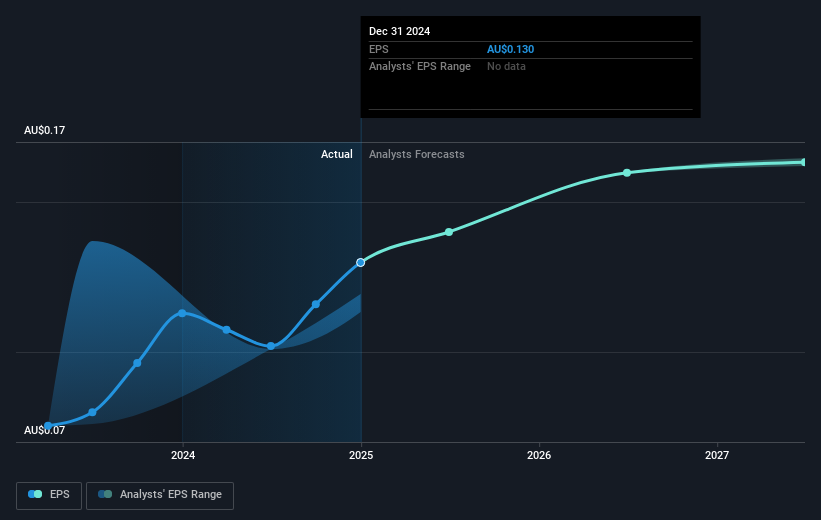
We know that Emeco Holdings has improved its bottom line lately, but is it going to grow revenue? Check if analysts think Emeco Holdings will grow revenue in the future.
What About The Total Shareholder Return (TSR)?
Investors should note that there's a difference between Emeco Holdings' total shareholder return (TSR) and its share price change, which we've covered above. The TSR is a return calculation that accounts for the value of cash dividends (assuming that any dividend received was reinvested) and the calculated value of any discounted capital raisings and spin-offs. Its history of dividend payouts mean that Emeco Holdings' TSR, which was a 26% drop over the last 5 years, was not as bad as the share price return.
A Different Perspective
We regret to report that Emeco Holdings shareholders are down 2.7% for the year. Unfortunately, that's worse than the broader market decline of 2.0%. Having said that, it's inevitable that some stocks will be oversold in a falling market. The key is to keep your eyes on the fundamental developments. However, the loss over the last year isn't as bad as the 5% per annum loss investors have suffered over the last half decade. We'd need to see some sustained improvements in the key metrics before we could muster much enthusiasm. Is Emeco Holdings cheap compared to other companies? These 3 valuation measures might help you decide.
We will like Emeco Holdings better if we see some big insider buys. While we wait, check out this free list of undervalued stocks (mostly small caps) with considerable, recent, insider buying.
Please note, the market returns quoted in this article reflect the market weighted average returns of stocks that currently trade on Australian exchanges.
Valuation is complex, but we're here to simplify it.
Discover if Emeco Holdings might be undervalued or overvalued with our detailed analysis, featuring fair value estimates, potential risks, dividends, insider trades, and its financial condition.
Access Free AnalysisHave feedback on this article? Concerned about the content? Get in touch with us directly. Alternatively, email editorial-team (at) simplywallst.com.This article by Simply Wall St is general in nature. We provide commentary based on historical data and analyst forecasts only using an unbiased methodology and our articles are not intended to be financial advice. It does not constitute a recommendation to buy or sell any stock, and does not take account of your objectives, or your financial situation. We aim to bring you long-term focused analysis driven by fundamental data. Note that our analysis may not factor in the latest price-sensitive company announcements or qualitative material. Simply Wall St has no position in any stocks mentioned.
Disclaimer: Investing carries risk. This is not financial advice. The above content should not be regarded as an offer, recommendation, or solicitation on acquiring or disposing of any financial products, any associated discussions, comments, or posts by author or other users should not be considered as such either. It is solely for general information purpose only, which does not consider your own investment objectives, financial situations or needs. TTM assumes no responsibility or warranty for the accuracy and completeness of the information, investors should do their own research and may seek professional advice before investing.
Most Discussed
- 1
- 2
- 3
- 4
- 5
- 6
- 7
- 8
- 9
- 10