Iluka Resources Limited (ASX:ILU) Looks Inexpensive After Falling 25% But Perhaps Not Attractive Enough
To the annoyance of some shareholders, Iluka Resources Limited (ASX:ILU) shares are down a considerable 25% in the last month, which continues a horrid run for the company. The recent drop completes a disastrous twelve months for shareholders, who are sitting on a 57% loss during that time.
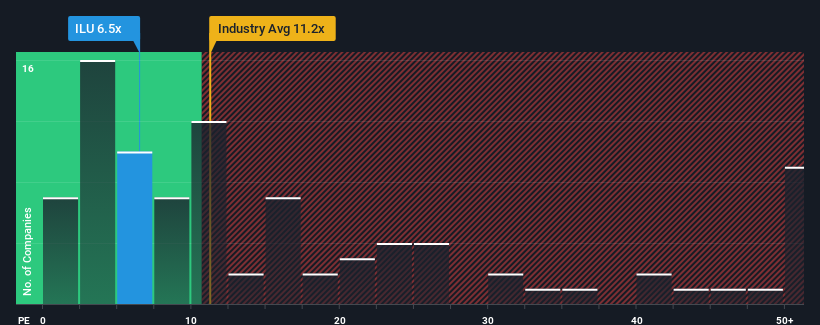
Following the heavy fall in price, Iluka Resources may be sending very bullish signals at the moment with its price-to-earnings (or "P/E") ratio of 5.8x, since almost half of all companies in Australia have P/E ratios greater than 17x and even P/E's higher than 29x are not unusual. Nonetheless, we'd need to dig a little deeper to determine if there is a rational basis for the highly reduced P/E.
AI is about to change healthcare. These 20 stocks are working on everything from early diagnostics to drug discovery. The best part - they are all under $10bn in marketcap - there is still time to get in early.
Iluka Resources could be doing better as its earnings have been going backwards lately while most other companies have been seeing positive earnings growth. It seems that many are expecting the dour earnings performance to persist, which has repressed the P/E. If this is the case, then existing shareholders will probably struggle to get excited about the future direction of the share price.
View our latest analysis for Iluka Resources
How Is Iluka Resources' Growth Trending?
There's an inherent assumption that a company should far underperform the market for P/E ratios like Iluka Resources' to be considered reasonable.
If we review the last year of earnings, dishearteningly the company's profits fell to the tune of 33%. This means it has also seen a slide in earnings over the longer-term as EPS is down 36% in total over the last three years. Accordingly, shareholders would have felt downbeat about the medium-term rates of earnings growth.
Looking ahead now, EPS is anticipated to slump, contracting by 6.4% each year during the coming three years according to the eight analysts following the company. With the market predicted to deliver 15% growth per year, that's a disappointing outcome.
With this information, we are not surprised that Iluka Resources is trading at a P/E lower than the market. Nonetheless, there's no guarantee the P/E has reached a floor yet with earnings going in reverse. There's potential for the P/E to fall to even lower levels if the company doesn't improve its profitability.
What We Can Learn From Iluka Resources' P/E?
Having almost fallen off a cliff, Iluka Resources' share price has pulled its P/E way down as well. Using the price-to-earnings ratio alone to determine if you should sell your stock isn't sensible, however it can be a practical guide to the company's future prospects.
We've established that Iluka Resources maintains its low P/E on the weakness of its forecast for sliding earnings, as expected. At this stage investors feel the potential for an improvement in earnings isn't great enough to justify a higher P/E ratio. It's hard to see the share price rising strongly in the near future under these circumstances.
You always need to take note of risks, for example - Iluka Resources has 1 warning sign we think you should be aware of.
Of course, you might also be able to find a better stock than Iluka Resources. So you may wish to see this free collection of other companies that have reasonable P/E ratios and have grown earnings strongly.
New: AI Stock Screener & Alerts
Our new AI Stock Screener scans the market every day to uncover opportunities.
• Dividend Powerhouses (3%+ Yield)• Undervalued Small Caps with Insider Buying• High growth Tech and AI CompaniesOr build your own from over 50 metrics.
Explore Now for FreeHave feedback on this article? Concerned about the content? Get in touch with us directly. Alternatively, email editorial-team (at) simplywallst.com.This article by Simply Wall St is general in nature. We provide commentary based on historical data and analyst forecasts only using an unbiased methodology and our articles are not intended to be financial advice. It does not constitute a recommendation to buy or sell any stock, and does not take account of your objectives, or your financial situation. We aim to bring you long-term focused analysis driven by fundamental data. Note that our analysis may not factor in the latest price-sensitive company announcements or qualitative material. Simply Wall St has no position in any stocks mentioned.
Disclaimer: Investing carries risk. This is not financial advice. The above content should not be regarded as an offer, recommendation, or solicitation on acquiring or disposing of any financial products, any associated discussions, comments, or posts by author or other users should not be considered as such either. It is solely for general information purpose only, which does not consider your own investment objectives, financial situations or needs. TTM assumes no responsibility or warranty for the accuracy and completeness of the information, investors should do their own research and may seek professional advice before investing.
Most Discussed
- 1
- 2
- 3
- 4
- 5
- 6
- 7
- 8
- 9
- 10