Little Excitement Around Pou Sheng International (Holdings) Limited's (HKG:3813) Earnings
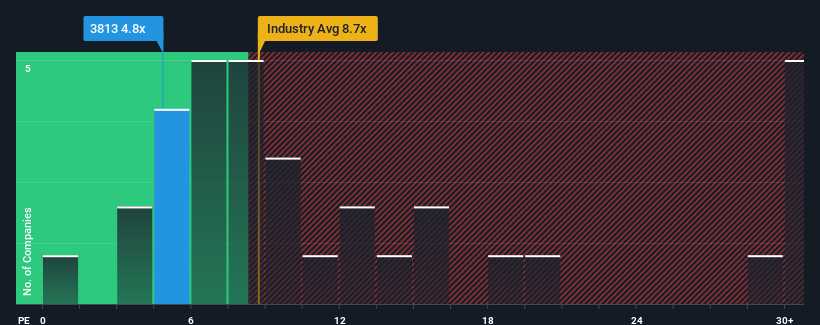
With a price-to-earnings (or "P/E") ratio of 4.8x Pou Sheng International (Holdings) Limited (HKG:3813) may be sending very bullish signals at the moment, given that almost half of all companies in Hong Kong have P/E ratios greater than 10x and even P/E's higher than 20x are not unusual. Although, it's not wise to just take the P/E at face value as there may be an explanation why it's so limited.
AI is about to change healthcare. These 20 stocks are working on everything from early diagnostics to drug discovery. The best part - they are all under $10bn in marketcap - there is still time to get in early.
Pou Sheng International (Holdings) could be doing better as it's been growing earnings less than most other companies lately. It seems that many are expecting the uninspiring earnings performance to persist, which has repressed the P/E. If you still like the company, you'd be hoping earnings don't get any worse and that you could pick up some stock while it's out of favour.
See our latest analysis for Pou Sheng International (Holdings)
How Is Pou Sheng International (Holdings)'s Growth Trending?
In order to justify its P/E ratio, Pou Sheng International (Holdings) would need to produce anemic growth that's substantially trailing the market.
Taking a look back first, we see that there was hardly any earnings per share growth to speak of for the company over the past year. Still, the latest three year period has seen an excellent 38% overall rise in EPS, in spite of its uninspiring short-term performance. So we can start by confirming that the company has done a great job of growing earnings over that time.
Turning to the outlook, the next three years should generate growth of 8.7% per year as estimated by the five analysts watching the company. That's shaping up to be materially lower than the 14% per annum growth forecast for the broader market.
In light of this, it's understandable that Pou Sheng International (Holdings)'s P/E sits below the majority of other companies. Apparently many shareholders weren't comfortable holding on while the company is potentially eyeing a less prosperous future.
The Bottom Line On Pou Sheng International (Holdings)'s P/E
We'd say the price-to-earnings ratio's power isn't primarily as a valuation instrument but rather to gauge current investor sentiment and future expectations.
As we suspected, our examination of Pou Sheng International (Holdings)'s analyst forecasts revealed that its inferior earnings outlook is contributing to its low P/E. Right now shareholders are accepting the low P/E as they concede future earnings probably won't provide any pleasant surprises. It's hard to see the share price rising strongly in the near future under these circumstances.
There are also other vital risk factors to consider before investing and we've discovered 1 warning sign for Pou Sheng International (Holdings) that you should be aware of.
You might be able to find a better investment than Pou Sheng International (Holdings). If you want a selection of possible candidates, check out this free list of interesting companies that trade on a low P/E (but have proven they can grow earnings).
New: Manage All Your Stock Portfolios in One Place
We've created the ultimate portfolio companion for stock investors, and it's free.
• Connect an unlimited number of Portfolios and see your total in one currency• Be alerted to new Warning Signs or Risks via email or mobile• Track the Fair Value of your stocks
Try a Demo Portfolio for FreeHave feedback on this article? Concerned about the content? Get in touch with us directly. Alternatively, email editorial-team (at) simplywallst.com.This article by Simply Wall St is general in nature. We provide commentary based on historical data and analyst forecasts only using an unbiased methodology and our articles are not intended to be financial advice. It does not constitute a recommendation to buy or sell any stock, and does not take account of your objectives, or your financial situation. We aim to bring you long-term focused analysis driven by fundamental data. Note that our analysis may not factor in the latest price-sensitive company announcements or qualitative material. Simply Wall St has no position in any stocks mentioned.
Disclaimer: Investing carries risk. This is not financial advice. The above content should not be regarded as an offer, recommendation, or solicitation on acquiring or disposing of any financial products, any associated discussions, comments, or posts by author or other users should not be considered as such either. It is solely for general information purpose only, which does not consider your own investment objectives, financial situations or needs. TTM assumes no responsibility or warranty for the accuracy and completeness of the information, investors should do their own research and may seek professional advice before investing.
Most Discussed
- 1
- 2
- 3
- 4
- 5
- 6
- 7
- 8
- 9
- 10