Calculating The Intrinsic Value Of MMTec, Inc. (NASDAQ:MTC)
Key Insights
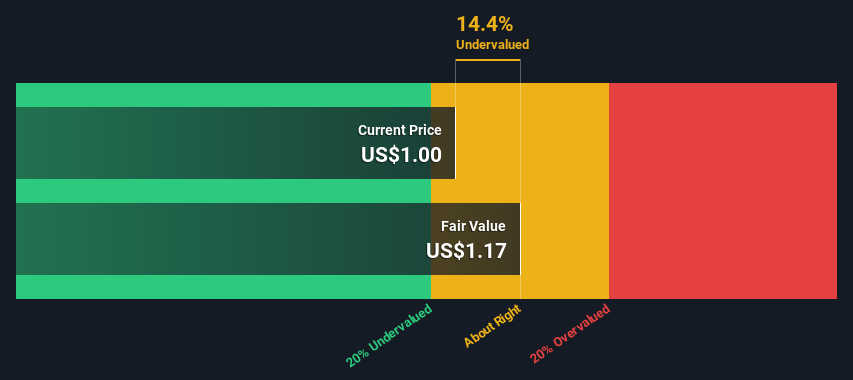
- Using the 2 Stage Free Cash Flow to Equity, MMTec fair value estimate is US$1.17
- MMTec's US$1.00 share price indicates it is trading at similar levels as its fair value estimate
- MMTec's peers seem to be trading at a lower discount to fair value based on the industry average of 5.6%
Today we'll do a simple run through of a valuation method used to estimate the attractiveness of MMTec, Inc. (NASDAQ:MTC) as an investment opportunity by projecting its future cash flows and then discounting them to today's value. One way to achieve this is by employing the Discounted Cash Flow (DCF) model. There's really not all that much to it, even though it might appear quite complex.
We generally believe that a company's value is the present value of all of the cash it will generate in the future. However, a DCF is just one valuation metric among many, and it is not without flaws. Anyone interested in learning a bit more about intrinsic value should have a read of the Simply Wall St analysis model.
AI is about to change healthcare. These 20 stocks are working on everything from early diagnostics to drug discovery. The best part - they are all under $10bn in marketcap - there is still time to get in early.
Is MMTec Fairly Valued?
We are going to use a two-stage DCF model, which, as the name states, takes into account two stages of growth. The first stage is generally a higher growth period which levels off heading towards the terminal value, captured in the second 'steady growth' period. In the first stage we need to estimate the cash flows to the business over the next ten years. Seeing as no analyst estimates of free cash flow are available to us, we have extrapolate the previous free cash flow (FCF) from the company's last reported value. We assume companies with shrinking free cash flow will slow their rate of shrinkage, and that companies with growing free cash flow will see their growth rate slow, over this period. We do this to reflect that growth tends to slow more in the early years than it does in later years.
Generally we assume that a dollar today is more valuable than a dollar in the future, so we discount the value of these future cash flows to their estimated value in today's dollars:
10-year free cash flow (FCF) forecast
| 2025 | 2026 | 2027 | 2028 | 2029 | 2030 | 2031 | 2032 | 2033 | 2034 | |
| Levered FCF ($, Millions) | US$1.14m | US$1.62m | US$2.10m | US$2.56m | US$2.98m | US$3.34m | US$3.65m | US$3.92m | US$4.15m | US$4.36m |
| Growth Rate Estimate Source | Est @ 58.61% | Est @ 41.85% | Est @ 30.12% | Est @ 21.91% | Est @ 16.16% | Est @ 12.14% | Est @ 9.32% | Est @ 7.35% | Est @ 5.97% | Est @ 5.00% |
| Present Value ($, Millions) Discounted @ 12% | US$1.0 | US$1.3 | US$1.5 | US$1.6 | US$1.7 | US$1.7 | US$1.6 | US$1.5 | US$1.5 | US$1.4 |
("Est" = FCF growth rate estimated by Simply Wall St)Present Value of 10-year Cash Flow (PVCF) = US$15m
After calculating the present value of future cash flows in the initial 10-year period, we need to calculate the Terminal Value, which accounts for all future cash flows beyond the first stage. The Gordon Growth formula is used to calculate Terminal Value at a future annual growth rate equal to the 5-year average of the 10-year government bond yield of 2.8%. We discount the terminal cash flows to today's value at a cost of equity of 12%.
Terminal Value (TV)= FCF2034 × (1 + g) ÷ (r – g) = US$4.4m× (1 + 2.8%) ÷ (12%– 2.8%) = US$47m
Present Value of Terminal Value (PVTV)= TV / (1 + r)10= US$47m÷ ( 1 + 12%)10= US$15m
The total value is the sum of cash flows for the next ten years plus the discounted terminal value, which results in the Total Equity Value, which in this case is US$29m. The last step is to then divide the equity value by the number of shares outstanding. Relative to the current share price of US$1.0, the company appears about fair value at a 14% discount to where the stock price trades currently. Remember though, that this is just an approximate valuation, and like any complex formula - garbage in, garbage out.
The Assumptions
Now the most important inputs to a discounted cash flow are the discount rate, and of course, the actual cash flows. Part of investing is coming up with your own evaluation of a company's future performance, so try the calculation yourself and check your own assumptions. The DCF also does not consider the possible cyclicality of an industry, or a company's future capital requirements, so it does not give a full picture of a company's potential performance. Given that we are looking at MMTec as potential shareholders, the cost of equity is used as the discount rate, rather than the cost of capital (or weighted average cost of capital, WACC) which accounts for debt. In this calculation we've used 12%, which is based on a levered beta of 1.864. Beta is a measure of a stock's volatility, compared to the market as a whole. We get our beta from the industry average beta of globally comparable companies, with an imposed limit between 0.8 and 2.0, which is a reasonable range for a stable business.
View our latest analysis for MMTec
Looking Ahead:
Although the valuation of a company is important, it is only one of many factors that you need to assess for a company. DCF models are not the be-all and end-all of investment valuation. Preferably you'd apply different cases and assumptions and see how they would impact the company's valuation. For instance, if the terminal value growth rate is adjusted slightly, it can dramatically alter the overall result. For MMTec, we've put together three important items you should assess:
- Risks: You should be aware of the 4 warning signs for MMTec (1 makes us a bit uncomfortable!) we've uncovered before considering an investment in the company.
- Other High Quality Alternatives: Do you like a good all-rounder? Explore our interactive list of high quality stocks to get an idea of what else is out there you may be missing!
- Other Environmentally-Friendly Companies: Concerned about the environment and think consumers will buy eco-friendly products more and more? Browse through our interactive list of companies that are thinking about a greener future to discover some stocks you may not have thought of!
PS. The Simply Wall St app conducts a discounted cash flow valuation for every stock on the NASDAQCM every day. If you want to find the calculation for other stocks just search here.
If you're looking to trade MMTec, open an account with the lowest-cost platform trusted by professionals, Interactive Brokers.
With clients in over 200 countries and territories, and access to 160 markets, IBKR lets you trade stocks, options, futures, forex, bonds and funds from a single integrated account.
Enjoy no hidden fees, no account minimums, and FX conversion rates as low as 0.03%, far better than what most brokers offer.
Sponsored ContentNew: Manage All Your Stock Portfolios in One Place
We've created the ultimate portfolio companion for stock investors, and it's free.
• Connect an unlimited number of Portfolios and see your total in one currency• Be alerted to new Warning Signs or Risks via email or mobile• Track the Fair Value of your stocks
Try a Demo Portfolio for FreeHave feedback on this article? Concerned about the content? Get in touch with us directly. Alternatively, email editorial-team (at) simplywallst.com.This article by Simply Wall St is general in nature. We provide commentary based on historical data and analyst forecasts only using an unbiased methodology and our articles are not intended to be financial advice. It does not constitute a recommendation to buy or sell any stock, and does not take account of your objectives, or your financial situation. We aim to bring you long-term focused analysis driven by fundamental data. Note that our analysis may not factor in the latest price-sensitive company announcements or qualitative material. Simply Wall St has no position in any stocks mentioned.
Disclaimer: Investing carries risk. This is not financial advice. The above content should not be regarded as an offer, recommendation, or solicitation on acquiring or disposing of any financial products, any associated discussions, comments, or posts by author or other users should not be considered as such either. It is solely for general information purpose only, which does not consider your own investment objectives, financial situations or needs. TTM assumes no responsibility or warranty for the accuracy and completeness of the information, investors should do their own research and may seek professional advice before investing.
Most Discussed
- 1
- 2
- 3
- 4
- 5
- 6
- 7
- 8
- 9
- 10