Genertec Universal Medical Group Company Limited's (HKG:2666) Share Price Is Matching Sentiment Around Its Earnings
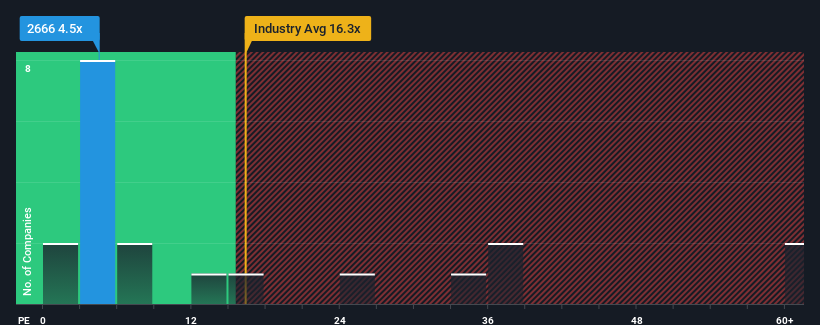
Genertec Universal Medical Group Company Limited's (HKG:2666) price-to-earnings (or "P/E") ratio of 4.5x might make it look like a strong buy right now compared to the market in Hong Kong, where around half of the companies have P/E ratios above 11x and even P/E's above 21x are quite common. Although, it's not wise to just take the P/E at face value as there may be an explanation why it's so limited.
Our free stock report includes 2 warning signs investors should be aware of before investing in Genertec Universal Medical Group. Read for free now.Genertec Universal Medical Group's earnings growth of late has been pretty similar to most other companies. It might be that many expect the mediocre earnings performance to degrade, which has repressed the P/E. If not, then existing shareholders have reason to be optimistic about the future direction of the share price.
See our latest analysis for Genertec Universal Medical Group
How Is Genertec Universal Medical Group's Growth Trending?
There's an inherent assumption that a company should far underperform the market for P/E ratios like Genertec Universal Medical Group's to be considered reasonable.
If we review the last year of earnings, the company posted a result that saw barely any deviation from a year ago. Still, the latest three year period was better as it's delivered a decent 8.9% overall rise in EPS. Accordingly, shareholders probably wouldn't have been overly satisfied with the unstable medium-term growth rates.
Shifting to the future, estimates from the three analysts covering the company suggest earnings should grow by 13% over the next year. Meanwhile, the rest of the market is forecast to expand by 17%, which is noticeably more attractive.
In light of this, it's understandable that Genertec Universal Medical Group's P/E sits below the majority of other companies. It seems most investors are expecting to see limited future growth and are only willing to pay a reduced amount for the stock.
The Key Takeaway
While the price-to-earnings ratio shouldn't be the defining factor in whether you buy a stock or not, it's quite a capable barometer of earnings expectations.
As we suspected, our examination of Genertec Universal Medical Group's analyst forecasts revealed that its inferior earnings outlook is contributing to its low P/E. Right now shareholders are accepting the low P/E as they concede future earnings probably won't provide any pleasant surprises. It's hard to see the share price rising strongly in the near future under these circumstances.
You need to take note of risks, for example - Genertec Universal Medical Group has 2 warning signs (and 1 which is a bit concerning) we think you should know about.
It's important to make sure you look for a great company, not just the first idea you come across. So take a peek at this free list of interesting companies with strong recent earnings growth (and a low P/E).
New: Manage All Your Stock Portfolios in One Place
We've created the ultimate portfolio companion for stock investors, and it's free.
• Connect an unlimited number of Portfolios and see your total in one currency• Be alerted to new Warning Signs or Risks via email or mobile• Track the Fair Value of your stocks
Try a Demo Portfolio for FreeHave feedback on this article? Concerned about the content? Get in touch with us directly. Alternatively, email editorial-team (at) simplywallst.com.This article by Simply Wall St is general in nature. We provide commentary based on historical data and analyst forecasts only using an unbiased methodology and our articles are not intended to be financial advice. It does not constitute a recommendation to buy or sell any stock, and does not take account of your objectives, or your financial situation. We aim to bring you long-term focused analysis driven by fundamental data. Note that our analysis may not factor in the latest price-sensitive company announcements or qualitative material. Simply Wall St has no position in any stocks mentioned.
Disclaimer: Investing carries risk. This is not financial advice. The above content should not be regarded as an offer, recommendation, or solicitation on acquiring or disposing of any financial products, any associated discussions, comments, or posts by author or other users should not be considered as such either. It is solely for general information purpose only, which does not consider your own investment objectives, financial situations or needs. TTM assumes no responsibility or warranty for the accuracy and completeness of the information, investors should do their own research and may seek professional advice before investing.
Most Discussed
- 1
- 2
- 3
- 4
- 5
- 6
- 7
- 8
- 9
- 10