Risks Still Elevated At These Prices As SMIT Holdings Limited (HKG:2239) Shares Dive 27%
The SMIT Holdings Limited (HKG:2239) share price has fared very poorly over the last month, falling by a substantial 27%. To make matters worse, the recent drop has wiped out a year's worth of gains with the share price now back where it started a year ago.
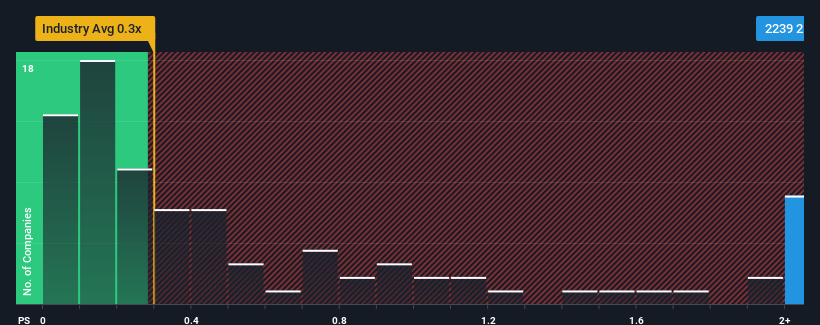
Even after such a large drop in price, you could still be forgiven for thinking SMIT Holdings is a stock not worth researching with a price-to-sales ratios (or "P/S") of 2.2x, considering almost half the companies in Hong Kong's Electronic industry have P/S ratios below 0.3x. Although, it's not wise to just take the P/S at face value as there may be an explanation why it's as high as it is.
Trump has pledged to "unleash" American oil and gas and these 15 US stocks have developments that are poised to benefit.
View our latest analysis for SMIT Holdings
How Has SMIT Holdings Performed Recently?
As an illustration, revenue has deteriorated at SMIT Holdings over the last year, which is not ideal at all. One possibility is that the P/S is high because investors think the company will still do enough to outperform the broader industry in the near future. If not, then existing shareholders may be quite nervous about the viability of the share price.
Want the full picture on earnings, revenue and cash flow for the company? Then our free report on SMIT Holdings will help you shine a light on its historical performance.Do Revenue Forecasts Match The High P/S Ratio?
In order to justify its P/S ratio, SMIT Holdings would need to produce impressive growth in excess of the industry.
In reviewing the last year of financials, we were disheartened to see the company's revenues fell to the tune of 38%. This means it has also seen a slide in revenue over the longer-term as revenue is down 61% in total over the last three years. Accordingly, shareholders would have felt downbeat about the medium-term rates of revenue growth.
Weighing that medium-term revenue trajectory against the broader industry's one-year forecast for expansion of 17% shows it's an unpleasant look.
In light of this, it's alarming that SMIT Holdings' P/S sits above the majority of other companies. Apparently many investors in the company are way more bullish than recent times would indicate and aren't willing to let go of their stock at any price. Only the boldest would assume these prices are sustainable as a continuation of recent revenue trends is likely to weigh heavily on the share price eventually.
The Key Takeaway
There's still some elevation in SMIT Holdings' P/S, even if the same can't be said for its share price recently. Typically, we'd caution against reading too much into price-to-sales ratios when settling on investment decisions, though it can reveal plenty about what other market participants think about the company.
We've established that SMIT Holdings currently trades on a much higher than expected P/S since its recent revenues have been in decline over the medium-term. Right now we aren't comfortable with the high P/S as this revenue performance is highly unlikely to support such positive sentiment for long. Should recent medium-term revenue trends persist, it would pose a significant risk to existing shareholders' investments and prospective investors will have a hard time accepting the current value of the stock.
It's always necessary to consider the ever-present spectre of investment risk. We've identified 3 warning signs with SMIT Holdings (at least 2 which can't be ignored), and understanding these should be part of your investment process.
If companies with solid past earnings growth is up your alley, you may wish to see this free collection of other companies with strong earnings growth and low P/E ratios.
New: Manage All Your Stock Portfolios in One Place
We've created the ultimate portfolio companion for stock investors, and it's free.
• Connect an unlimited number of Portfolios and see your total in one currency• Be alerted to new Warning Signs or Risks via email or mobile• Track the Fair Value of your stocks
Try a Demo Portfolio for FreeHave feedback on this article? Concerned about the content? Get in touch with us directly. Alternatively, email editorial-team (at) simplywallst.com.This article by Simply Wall St is general in nature. We provide commentary based on historical data and analyst forecasts only using an unbiased methodology and our articles are not intended to be financial advice. It does not constitute a recommendation to buy or sell any stock, and does not take account of your objectives, or your financial situation. We aim to bring you long-term focused analysis driven by fundamental data. Note that our analysis may not factor in the latest price-sensitive company announcements or qualitative material. Simply Wall St has no position in any stocks mentioned.
Disclaimer: Investing carries risk. This is not financial advice. The above content should not be regarded as an offer, recommendation, or solicitation on acquiring or disposing of any financial products, any associated discussions, comments, or posts by author or other users should not be considered as such either. It is solely for general information purpose only, which does not consider your own investment objectives, financial situations or needs. TTM assumes no responsibility or warranty for the accuracy and completeness of the information, investors should do their own research and may seek professional advice before investing.
Most Discussed
- 1
- 2
- 3
- 4
- 5
- 6
- 7
- 8
- 9
- 10