RFI: Real Estate Fund With 7.7% Plus Income For The Long Term
Khanchit Khirisutchalual
Introduction
Cohen & Steers Total Return Realty (NYSE:RFI) is a closed-end fund, or CEF, incepted in September 1993. The fund is one of the few CEFs that have a successful record of more than 25 years. The fund primarily invests in equities and debt securities of real estate companies and REITs (Real-Estate Investment Trusts). Furthermore, it suits conservative investors who do not like leveraged funds. It is mostly a domestic fund, as more than 80% of its assets are invested in U.S.-based securities.
As per the fund's literature,
“The investment objective of the Fund is to seek to achieve a high total return through investment in real estate securities. Real estate securities include common stocks, preferred stocks, and other equity securities of any market capitalization issued by real estate companies, including real estate investment trusts (REITs) and similar REIT-like entities.”
Other salient features of this fund are as follows:
- The fund is focused on real-estate companies, which includes many of the well-known large-capitalized REITs.
- The fund is managed by the Cohen & Steers group, which is a leading global investment manager specializing in real assets and alternative income, including real estate, preferred securities, infrastructure, resource equities, commodities, as well as multi-strategy solutions.
- This fund uses zero leverage. As most readers are aware, the leverage works both ways. The use of leverage can increase the total returns in a rising market but can also have the opposite effect in a declining market. Leverage can also make a fund more volatile than it would be otherwise. During a high interest rate environment, leverage would add a lot of additional interest burden. So, basically, conservative investors should like this fund. Folks who do not mind leverage could also look at its leveraged sibling, Cohen & Steers Quality Income Realty Fund (RQI). With lower interest rates on the horizon, RQI could be an interesting candidate as well.
- The fund has a reasonably good record of long-term performance. However, the past three years have been turbulent, and the performance has been mediocre at best. Longer term, as of Dec.31, 2023, since inception in 1993, the fund has returned 9.32% on a NAV basis, annualized, compared to 10.02% for the S&P500. Based on market prices, as of Dec.31, 2023, it has returned 8.50%, 10.38%, and 4.41% over 10-year, 5-year, and 1-year timeframes, respectively. However, we also have to keep in mind that we had a terrible couple of years for the real-estate sector. These results assume that all distributions were reinvested.
- The fund employs a managed distribution policy under which it distributes $0.08 per share every month ($0.96 annually). It has paid the same amount since 2016. Since its inception in 1993 until Aug. 2024, it has paid a cumulative amount of roughly $41.60 a share. At the same time, its current NAV is roughly 14% below the inception NAV.
- The fund can invest globally, per its mandate. However, it is mostly invested in the domestic market, to the extent of 80% plus. Just under 20% of its assets are invested in other countries like the U.K., Canada, Australia, the Netherlands, Switzerland, Germany, Spain, and Italy.
- It is a reasonably diversified fund, but it is a bit top-heavy, with the top 10 holdings accounting for nearly 50% of the total assets. The top 10 holdings are well-known large-capitalized REITs (Real Estate Investment Trusts). On the equity side, it has less than 40 holdings, but there are numerous positions on the debt/preferred side, making a total of 175 holdings (as of Jun.30, 2024).
- As of Aug. 20, 2024, the fund had roughly $322 million worth of assets under its management.
- The fund is an actively managed fund, and as of last year's annual report as of Jun. 30, 2024, it reported a management fee and other expenses of 0.89% on net (or managed) assets. There is almost zero leverage, so there are no interest expenses to speak of.
- As of Aug. 20, 2024, its distribution yield on the market price was 7.77% and 7.90% on the NAV.
- As of Aug. 20, 2024, RFI's market price was at a premium of +1.56% to its NAV., whereas the 3-year and 5-year averages have been in the similar range but slightly higher, with premiums of 3.04% and 2.74%, respectively.
Financial Outlook
Let's look at the Fund's Financial health and performance. The most recent detailed report that is available to investors is the annual report ending on Dec. 31, 2023, and the previous year's annual report for the period ending Dec. 31, 2022. Unfortunately, the semi-annual report ending the period Jun. 30, 2024, is not available yet, as the company has only provided a fact sheet as of that date. However, the NAV has actually been on the rise in the year 2024.
Net Investment Income:
The net investment income (or NII in short) is the net income that a fund earns from its investment in the form of dividends, distributions, and interests or derivatives like options. It subtracts all the fund's expenses, including management fees, operating expenses, commissions, and interest on leverage. For equity-based funds, especially in high-growth sectors like technology, the NII is not very relevant. However, for fixed-income or bond funds, it is very relevant.
Here is what it looks like in terms of NII, Distributions, and Net Assets at the beginning and end of the statement period.
All amounts are in US $ (except Shares Outstanding) for the 12-month period ending on Dec. 31, 2023, and the previous year's 12-month period ending on Dec. 31, 2022. The negative amounts are shown inside parentheses.
Table-1:
Author (Data source: RFI's 2023 annual report)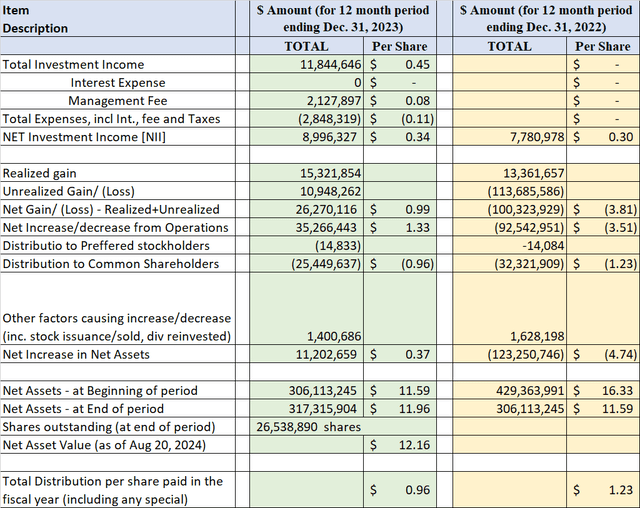
Distributions
RFI provides managed distribution on a monthly basis of $0.08 per share, which comes out to be a yield of 7.77% at current prices (as of 08/20/2024), which has come down significantly from October last year when real estate was at rock bottom.
It has paid the same amount of distributions for a long time, at least since 2016. Before 2016, it paid the same amount but on a quarterly basis. Furthermore, it cut the distribution amount during the 2008-2009 period and changed the frequency to quarterly. Since its inception in 1993, the fund has paid $41.63 a share in distributions (including specials) while maintaining the NAV, by and large. The current NAV is only about 14% lower than the inception NAV. Overall, management has done a good job of managing the distribution policy and making the distribution sustainable.
So, is the distribution covered?
RFI assets are 80% equity and 20% bonds/preferred securities, so there is simply not enough NII (Net Investment Income) to cover all the expenses and distribution. So, it has to meet the major part of distributions from realized capital gains. However, to the credit of management, despite the tough environment during the last couple of years, from years 2019-2023, we see that a minimal percent of distributions (less than ½%) was paid as ROC (return of capital). This indicates that they can generate enough income and capital gains to meet their regular obligations. In addition, they could pay special distributions in 3 out of 5 years.
Table-2: Distribution Data (Years 2019-2023)
Author (Source: Fund's Section 19 notices)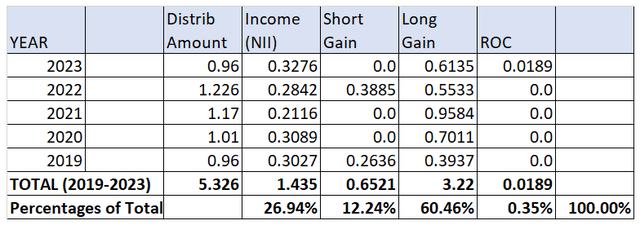
So, clearly, we can give a vote of confidence to the management on distribution sustainability. In addition, things are likely to get better in the immediate future. As we are already over the peak interest rates, real estate valuations will recover with the decline in interest rates.
Discount/Premium
The fund is currently trading at a small premium of +1.56% (to its NAV). If we look at the history of the last five years, we observe that it has mostly traded at a small premium, except for the year 2023. Furthermore, we can see that z-scores for 3-month, 6-month, and 1-year are all in positive numbers, indicating that the fund is slightly expensive compared to where it was last year.
However, we should always look at both the premium/discount and the overall valuation of the fund and the sector. Generally speaking, in 2022/2023, the high-interest regime had hit the valuations of all income-generating securities, but that has been changing recently due to expectations of declining rates in 2024 and 2025.
Below, a five-year chart is presented, showing the discount and premium information.
Chart-1: RFI – Premium/Discount Chart
CEFConnect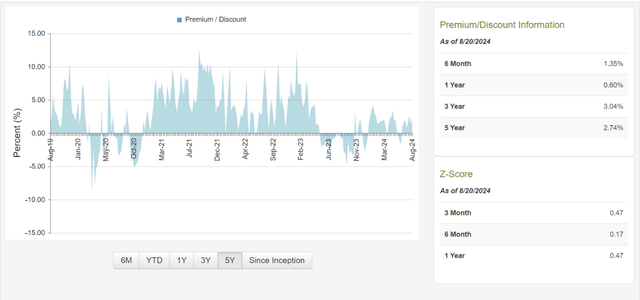
Fund's Holdings
As of Jun. 30, 2024, it had roughly 175 positions, with nearly 80% of the assets in equities and 20% in preferred or bond securities. The fund is sector-specific but fairly diversified within the sector. It is spread across many segments of the real estate sector.
The top 10 holdings of the fund make up nearly 51% of the total assets, a significant portion. Some of its largest holdings are American Tower (AMT), Welltower (WELL), Prologis (PLD), Digital Realty (DLR), Simon Property (SPG), Equinix (EQIX), and Invitation Homes (INVH), among others.
The top holdings and asset composition as of Jun. 30, 2024, are presented below.
Table-3: Holdings as of 06/30/2024
Source: Fund's factsheet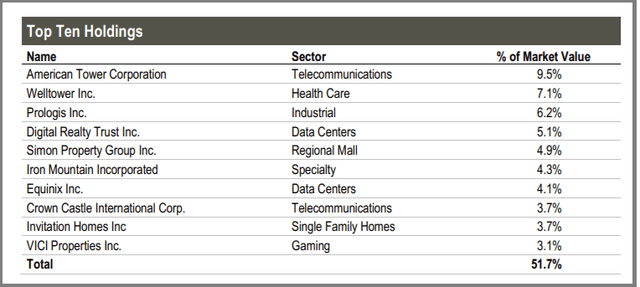
Source: Fund's fact sheet
Chart-2: Sector Allocations as of 06/30/2024
Source: Fund's factsheet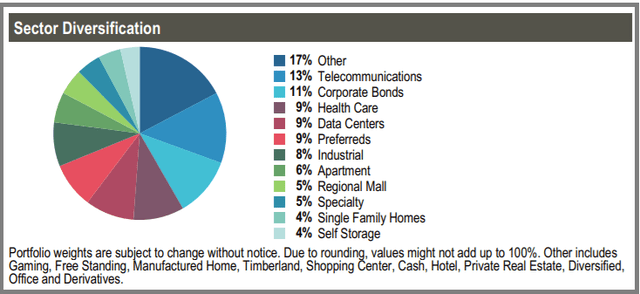
Performance and Valuation
Since its inception in 1993, until Jul. 31, 2024, RFI has returned 9.44% (annualized) on an NAV basis, compared to 10.38% for the S&P 500. Considering the fact that the real estate sector had a tough few years due to the high interest rate environment, we will consider this performance quite decent. However, the picture is quite different if you look at the recent performance, especially the last three years. RFI returned less than 1% annualized (including dividends) in the past three years. However, RFI is not alone; it has been the case with most income funds, especially in the real estate sector. Last year, in 2023, we saw some decent gains, but they still lagged the S&P 500 (SP500) quite a bit. The fact that the fund has become pricier in the recent period is also reflected in the z-scores.
Let's see how the fund compares over the last 3, 5, and 10 years (and since inception) with the S&P 500 and a host of other funds and ETFs in the real estate sector. Many of these funds differ from RFI in terms of leverage, as they deploy a decent amount of leverage, while RFI does not. We will also include the S&P 500 as a reference point, although it is not the benchmark for real estate funds.
- RFI
- Cohen & Steers Quality Income Realty Fund - RQI
- CBRE Global Real Estate Income Fund (IGR)
- Nuveen Real Asset Income and Growth Fund (JRI)
- Vanguard Real Estate Index Fund ETF (VNQ)
- SPDR S&P 500 ETF Trust (SPY).
Table-5: (Data - period as specified, if not specified then as of Jul. 30, 2024)
Item Desc. | RFI | RQI | IGR | JRI | VNQ | S&P 500 |
Dividend Yield% (as of 08/20/2024) | 7.77% | 7.46% | 12.20% | 12.55% | 3.87% | 1.30% |
Annualized Return [CAGR] From Jan. 2005 – Jul. 31, 2024 (NAV) | 7.35% | 6.40% | 3.01% | n/a | 6.90% | 10.06% |
Annualized Return [CAGR] From Jan. 2013 – Jul. 2024 (NAV) | 7.83% | 9.27% | 3.31% | 5.62% | 6.94% | 14.37% |
Max. Drawdown 2013 – Jul. 2024 (NAV) | -26.18% | -33.36% | -46.05% | -40.30% | -32.78% | -23.95% |
Std. Deviation 2013– Jun. 2024 (NAV) | 14.98% | 20.10% | -19.99% | 16.68% | 17.58% | 14.58% |
10-Year CAGR (Aug. 2014 – Jul. 2024) NAV | 7.20% | 8.34% | 2.28% | 3.87% | 6.08% | 13.00% |
5-Year CAGR NAV | 5.71% | 6.30% | 0.95% | 1.28% | 4.98% | 14.84% |
3-Year CAGR NAV | 0.31% | 0.34% | -7.25% | 0.28% | -1.53% | 9.44% |
1-Year CAGR NAV | 10.48% | 12.67% | 6.92% | 9.68% | 10.66% | 21.98% |
Fees (excluding interest) | 0.89% | 1.42% | 1.39% | 1.54% | 0.13% | 0.09% |
Leverage | 0% | 29.7% | 26.1% | 28.53% | 0 | 0% |
No. of holdings | 175 | 195 | 84 | 401 | 159 | 504 |
Assets | $322 Million | $2.4 Billion | $1.1 Billion | $532 Million | $66.5 Billion | $556 Billion |
Allocation | RE sector, 80% Equity, 20% Preferred/ Bond | RE sector, 80% Equity, 20% Preferred/ Bond | RE sector, 94% Equity, 6% Preferred/ Bond | RE sector, 50% Equity, 50% Preferred/ Bond | Real Estate Index Fund ETF | Largest 500 US companies |
Note: Some of the data (e.g., number of holdings and leverage) may not be current.
During the last three years, the real estate sector has vastly diverged from the S&P 500. However, more recently, there has been some recovery in the real estate sector. Out of five funds, only RFI and VNQ do not use leverage, while the other three do. So, comparisons in the above table are not apples-to-apples types, but they provide some broad comparisons. For the most part, RFI has outperformed VNQ (the passive sector index fund ETF) in spite of VNQ's much lower fees. However, it was not able to beat its leveraged sibling, RQI (from the same fund family), most of the time. RQI, in spite of its higher fees and interest expenses, performed equally well or slightly better for most time periods, which shows the manager's effectiveness in using the leverage to its advantage.
Risk Factors
Investors need to be aware of certain risk factors that are associated with this fund and CEFs in general. Risk factors could be summarized as follows:
- RFI is a real-estate sector-specific fund. Even though it is diversified among various segments, it cannot escape the headwinds if the entire sector was facing challenges, as was the case in 2022-2023 for the real-estate sector.
- The real estate sector is highly sensitive to the direction of the interest rates. Even though RFI uses no leverage, the valuations of the real estate take a hit when interest rates rise due to the opportunity cost. It is now almost taken for granted that interest rates will decline from here on, starting with at least two rate cuts by the Fed in 2024, followed by four to five more cuts in 2025. In a declining interest rate environment, the real estate sector as a whole is expected to do better. However, there is no guarantee that the rate will decline as fast as expected and is not likely to go to zero.
- The general risks, such as the geopolitical situation.
- With the recent market volatility, there is a renewed fear and possibility of the occurrence of a recession in early or mid-2025.
- Market risks: In 2024, the S&P 500 has been making new highs on the back of large technology stocks and the AI-fueled boom. A significant correction in the broader market remains a real risk.
Concluding Thoughts
RFI fund shares are currently trading at a small premium of 1.56% and offer roughly 7.75% yield.
We believe most investors need to have 10-15% exposure to the real-estate sector; however, it should be diversified within the various segments of the sector.
For income investors who need a high income but want to avoid leveraged funds, Cohen & Steers Total Return Realty is a good choice as a long-term holding, with predictable income and some modest capital appreciation over and above the distributions. The shares are substantially more expensive compared to last year, and the yield has come down by a percentage point, but it may not be too late. So, the fund may not be an outright buy, but it can still be accumulated on a dollar-cost-average basis. For existing investors with full positions, it is certainly a "hold."
免责声明:投资有风险,本文并非投资建议,以上内容不应被视为任何金融产品的购买或出售要约、建议或邀请,作者或其他用户的任何相关讨论、评论或帖子也不应被视为此类内容。本文仅供一般参考,不考虑您的个人投资目标、财务状况或需求。TTM对信息的准确性和完整性不承担任何责任或保证,投资者应自行研究并在投资前寻求专业建议。
热议股票
- 1
- 2
- 3
- 4
- 5
- 6
- 7
- 8
- 9
- 10