PBW: Clean Energy Stocks Catch A Post-Debate Bid, Caution Warranted

Justin Paget
The second presidential debate, the first featuring Vice President Kamala Harris, did not go well for former President Trump. He took the bait on a number of casts by the VP, and betting markets responded by selling the chances that the 45th POTUS would move back into the White House come next January.
While Trump is still slightly favored to win in November, higher odds that Harris would earn the 270 electoral votes needed to capture the victory resulted in a sharp rally in many clean energy stocks. Specifically, solar equities did quite well. More broadly, the embattled Invesco WilderHill Clean Energy ETF (NYSEARCA:PBW) sprung to life, but it remains in a protracted downtrend going back to early 2021.
The upside case is straightforward – if Harris wins, she would not impose the strict tariffs that Trump seeks. It’s tricky, however, as renewable energy equities have been among the biggest-losing industries in the global stock market since the Biden/Harris administration took office.
I reiterate a hold rating on PBW. Its valuation has actually turned more expensive since I last reviewed the fund in 2023 while its technical situation remains dreadful. I will highlight key price points to monitor later in the article.
Harris Climbs in the Prediction Markets Post-Debate
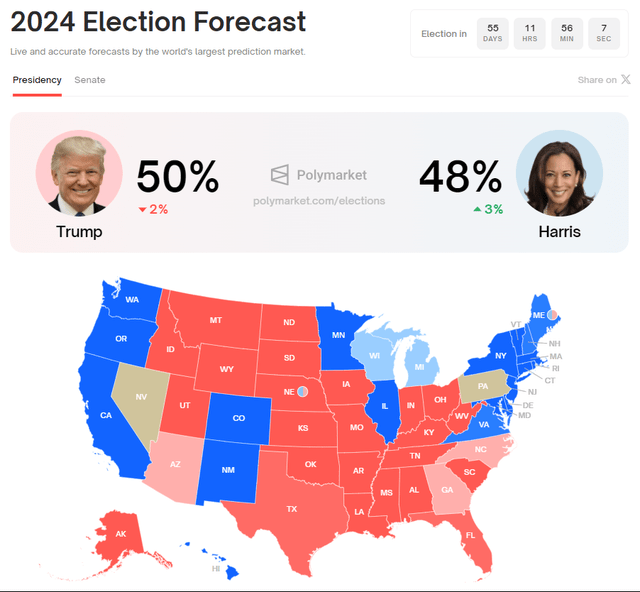
Polymarket
About a 30% Chance of a Second Trump-Harris Debate
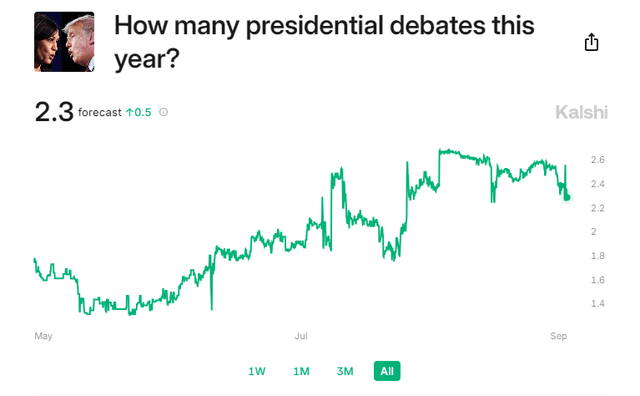
Kalshi
According to the issuer, PBW is based on the WilderHill Clean Energy Index. The fund will normally invest at least 90% of its total assets in common stocks that comprise the index. The fund invests in stocks of companies operating across energy, utilities, alternative energy resources, independent power and renewable electricity producers, and renewable electricity sectors. The fund and the index are rebalanced and reconstituted quarterly.
PBW is now a small ETF with just $280 million in assets under management as of September 10, 2024. That is sharply down from $454 million as of December last year. Its annual expense ratio is on the high side at 0.65% while the fund yields a high 3.72% given depressed stock prices among some of its holdings. Share-price momentum continues to be awful – Seeking Alpha’s quantitative ETF grading system shows an “F” rating currently, and since this past March.
Compounding the dour outlook are poor risk metrics, including high annualized volatility readings and a somewhat concentrated allocation. Liquidity is the only decent spot given PBW’s average daily volume of more than 290,000 shares, but its median 30-day bid/ask spread of 11 basis points is elevated, so I encourage investors to use limit orders during the trading day, particularly around the market open.
Down 47% on the year, I am hesitant to downgrade the fund to a sell given sour sentiment offering the potential for a year-end rally, but the 1-star, Neutral-rated ETF by Morningstar’s price-to-earnings ratio is not screaming cheap at 22.1. Its price-to-sales multiple is low, though, at just 1.1 - that is about 20% cheaper than my previous analysis. Considering that PBW is almost entirely a small-cap fund, there’s added cyclical risk.
PBW: Cheap P/S Ratio, Elevated Small-Cap Risk
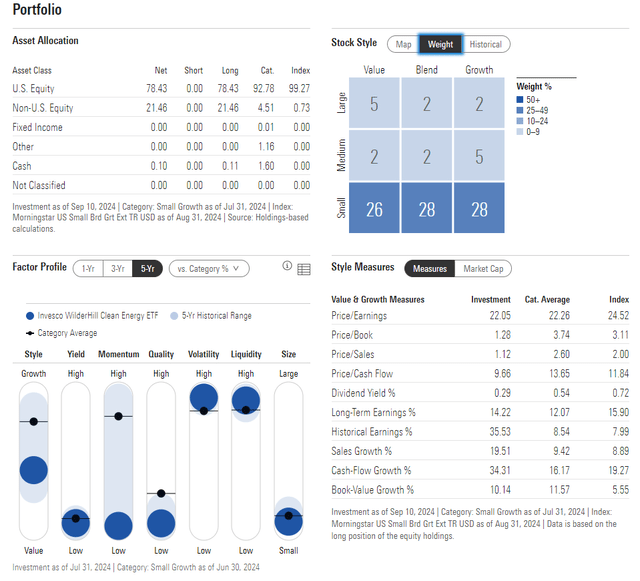
Morningstar
PBW is not overly concentrated, but the fund is allocated to just five sectors, not counting a very small Consumer Staples exposure. The good news is that the top 10 holdings only account for about one-quarter of PBW, so it’s unlikely that a single name will have a very high impact on any one day.
PBW: Alternative Energy Access Across 5 Sectors
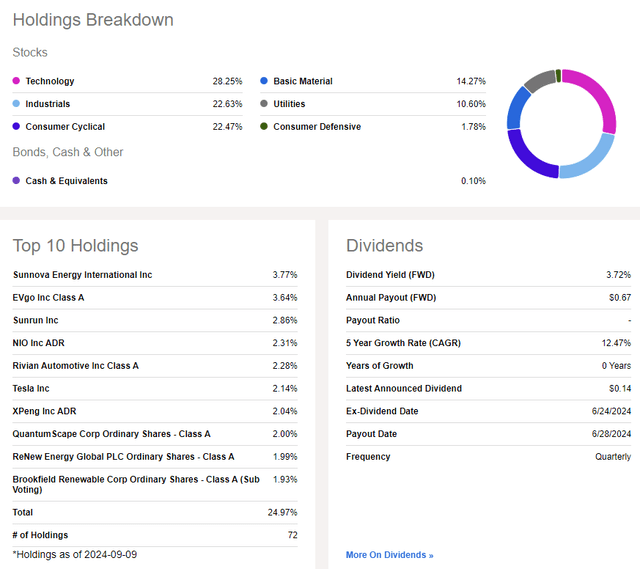
Seeking Alpha
We are also in the throes of bearish seasonal trends. September has historically been the worst month on the calendar for global clean energy stocks, and weakness often extends into October.
But the very end of the year has been strong in PBW’s history. A Harris win in November could be a major spark for both short covering and speculative long positions being taken in the ETF.
PBW: Bearish September-October Trends, Bullish Late-Year
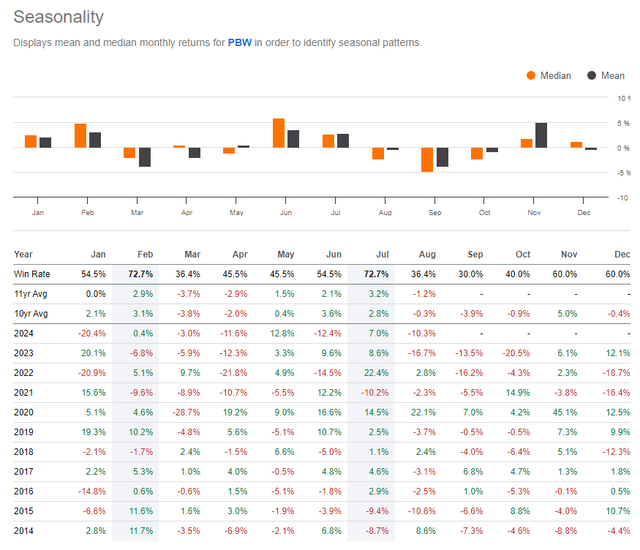
Seeking Alpha
The Technical Take
While there are hopeful bullish catalysts, the reality is that the bears are in firm control of PBW’s technical trend. Notice in the chart below that shares are mired in a prolific downward spiral. Resistance is obvious near $27 based on where the downward-sloping channel line comes into play, while a bounce would hypothetically come if PBW touched about $15. Also take a look at the long-term 200-day moving average – it has been trending lower for years, further cementing that the bears are running the show.
But notice the RSI momentum gauge at the top of the graph – it printed a bullish divergence to price. As PBW sunk to fresh multi-year lows, the RSI gauge made a higher low. That’s thought to be a harbinger of better price action to come. The onus is on the bulls, however, to change the broader trend. If PBW can rise through the $24 to $25 area – the high from July and through the 200dma - then a better technical case can be made.
For now, the chart is firmly bearish.
PBW: Protracted Downtrend Remains In Place, Bullish RSI Divergence
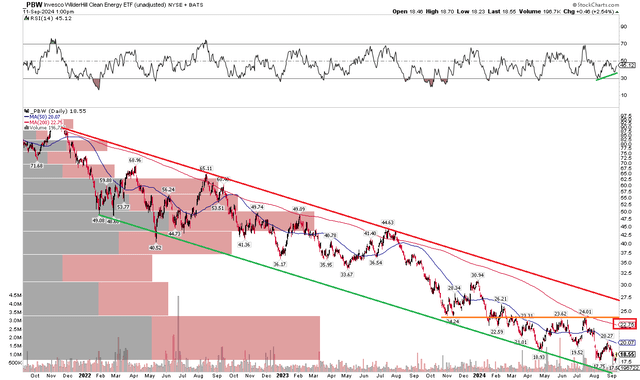
StockCharts.com
The Bottom Line
With a cheap price-to-sales ratio and the prospect of a potential Harris presidential term, there are some appealing factors of PBW. But the group of global clean energy stocks is not cheap on earnings and the chart situation is poor.
免责声明:投资有风险,本文并非投资建议,以上内容不应被视为任何金融产品的购买或出售要约、建议或邀请,作者或其他用户的任何相关讨论、评论或帖子也不应被视为此类内容。本文仅供一般参考,不考虑您的个人投资目标、财务状况或需求。TTM对信息的准确性和完整性不承担任何责任或保证,投资者应自行研究并在投资前寻求专业建议。
热议股票
- 1
- 2
- 3
- 4
- 5
- 6
- 7
- 8
- 9
- 10