INDA: India's Foreign Investor Resurgence Has Just Begun

swissmediavision
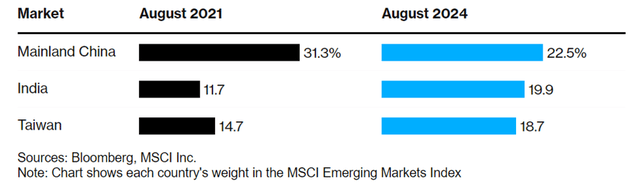
Indian large-cap equities have outpaced its emerging market peers yet again this year, and as a result, the country’s weighting in key benchmarks has steadily risen in tandem. Last week saw India hit yet another milestone in this regard, displacing China as the largest country weighting within the MSCI Emerging Markets Investable Market Index (or "MSCI IMI").

Infoindata
As I discuss in the article, the implication from a "flow of funds" perspective is quite significant, as a larger percent of global assets that track these indices ($120bn for MSCI IMI and >$500bn for the larger MSCI Emerging Market Index) will effectively be forced into India. And as India’s fortunes continue to diverge from its global peers, there’s plenty of space for much larger index-related catalysts, with iShares' flagship MSCI India ETF (BATS:INDA) standing out as the prime "flow of funds" beneficiary.
Bloomberg
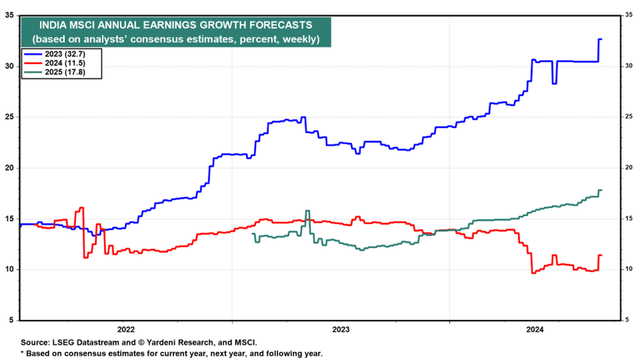
Of course, the technical "flow of funds" tailwind means little without fundamental support. On this front, India has a lot to offer, from its >10% nominal GDP growth (fastest among the world’s major economies) to a compelling combination of earnings quality (high-teens return on equity) and growth (high-teens % YoY forward). Combine this with a seemingly unstoppable domestic bid, and it’s hard to see the Indian growth story slowing down anytime soon.
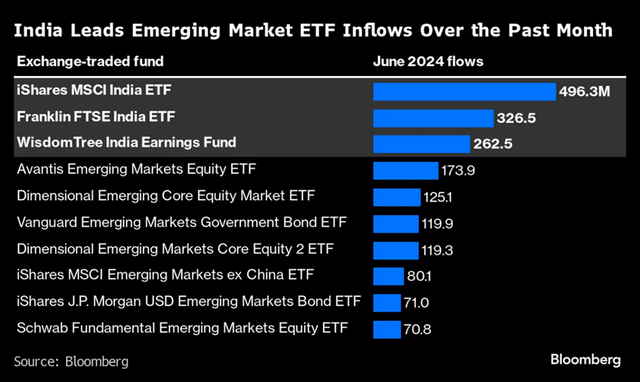
The Foreign Equity Bid is Growing…
One of the most striking facts about the Indian rally is how little foreign participation there has been so far – in contrast with record domestic equity inflows. In fact, heading into the Q2 election season, foreign institutional investors (or FIIs) were net sellers of Indian equities. Now that policy continuity has prevailed. However, foreign buying has surged, topping $10bn post election. Note that this includes a period of heavy FII selling through Q3 when carry trades were being unwound globally.
NSDL
The good news is that the foreign bid is likely to get a lot bigger now that India has overtaken China as the largest MSCI EM IMI weighting. Next up is the much larger MSCI Emerging Market Index (>$500bn vs $120bn for MSCI IMI) where the gap has closed massively in recent years. And beyond that, much larger global indices, where India is coming off a much smaller percentage base.
Bloomberg
The key implication here is that bigger index weights entail more (forced) buying pressure from passives and "benchmark aware" active funds. In sum, a big and sustained technical tailwind to come from foreign investors – one that should disproportionately benefit large-caps (where foreign participation is highest) and large-cap-focused INDA.
…so is the Foreign-Fixed Income Bid
Foreign flows into India’s sovereign debt market, on the other hand, is less discussed but has been gaining impressive traction. August data, for instance, showed inflows are further accelerating – no doubt helped by India’s recent inclusion into JPMorgan's all-important Government Bond Index-Emerging Markets (GBI-EM) benchmark, as well as policy continuity post elections. Now, India's GBI-EM index weight will only continue to rise until it hits the 10% target by early 2025 (vs. ~3% currently). And with Fed interest rate cut expectations now repricing US Treasury yields a lot lower, expect a lot more foreign debt inflows through year-end.
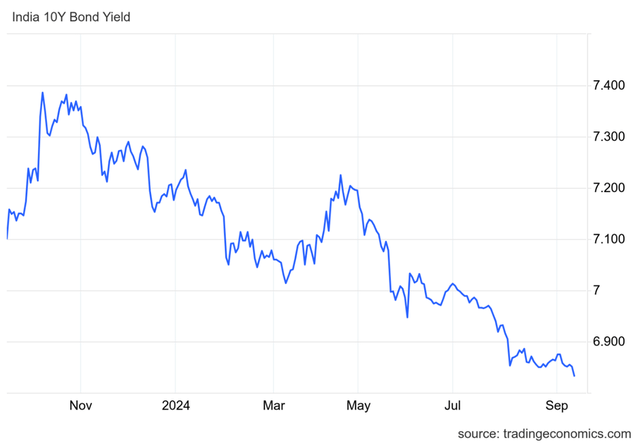
Tradingeconomics
Sovereign debt inflows bode well for equities because they bring down the cost of capital "floor." A lower risk-free rate (proxied by the 10-year Indian government bond), for instance, directly feeds into the cost of equity used to discount future cash flows, driving up equity valuations. As for corporates, access to lower-cost debt financing unlocks a lot more growth opportunities and improves the potential return to equity owners long term.
In the context of these massive technical tailwinds and with Indian corporate earnings power continuing to trend very strongly (high teens percent growth), INDA’s current ~24x forward P/E isn’t all that expensive, in my view.
Yardeni
INDA as a "Flow of Funds" Beneficiary
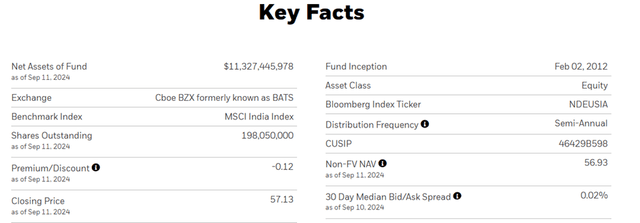
As foreign investor flows tend to be concentrated in India’s large caps, playing the "flow of funds" theme via a large-cap-focused ETF makes a lot of sense. At the top of the list is INDA, the largest (~$11.3bn managed assets) and most liquid (~2bps bid/ask) India ETF.
iShares
Elsewhere, the fund takes a decidedly "middle ground" approach. Take, for instance, its fee structure, which doesn’t quite match the 0.19% offered by Franklin Templeton’s FTSE India ETF (FLIN), but remains well below other large-cap options like iShares’ India 50 ETF (INDY). As for portfolio construction, INDA (151 stocks) runs less breadth than FLIN (231 stocks), but more than the highly concentrated, 50-stock INDY. Hence, INDA’s "middle ground" performance vs. FLIN and INDY.
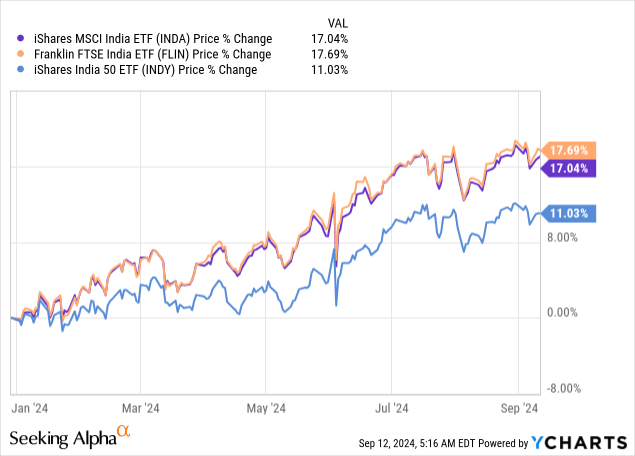
Now, whether breadth will continue to be the winning large-cap formula is anyone's guess, and it wouldn’t surprise me at all if the pecking order reverses in a downturn. What's easier to underwrite, on the other hand, is iShares’ ability to maintain INDA’s narrow "tracking error" (i.e., the performance gap vs its MSCI India benchmark) – a particularly important differentiator as we enter a higher capital tax regime in India. So on balance, for otherwise agnostic investors looking to play India’s "flow of funds" tailwind, INDA still screens very attractively.
Summing Up
As global portfolio allocations to India continue their steady rise, large-cap focused INDA stands out as a great way to play the theme. Yes, valuations are also higher, though relative to a very strong fundamental and technical backdrop, India's risk/reward remains as compelling as ever.
免责声明:投资有风险,本文并非投资建议,以上内容不应被视为任何金融产品的购买或出售要约、建议或邀请,作者或其他用户的任何相关讨论、评论或帖子也不应被视为此类内容。本文仅供一般参考,不考虑您的个人投资目标、财务状况或需求。TTM对信息的准确性和完整性不承担任何责任或保证,投资者应自行研究并在投资前寻求专业建议。
热议股票
- 1
- 2
- 3
- 4
- 5
- 6
- 7
- 8
- 9
- 10