Bitcoin Price Analysis: The 2 Most Probable Scenarios For BTC in the Short Term
Bitcoin’s price remains in a state of indecision, confined within a tight consolidation range bounded by the 100-day and 200-day moving averages.
An impending breakout from this range will likely determine the asset’s short-term direction.
Technical Analysis
By Shayan
The Daily Chart
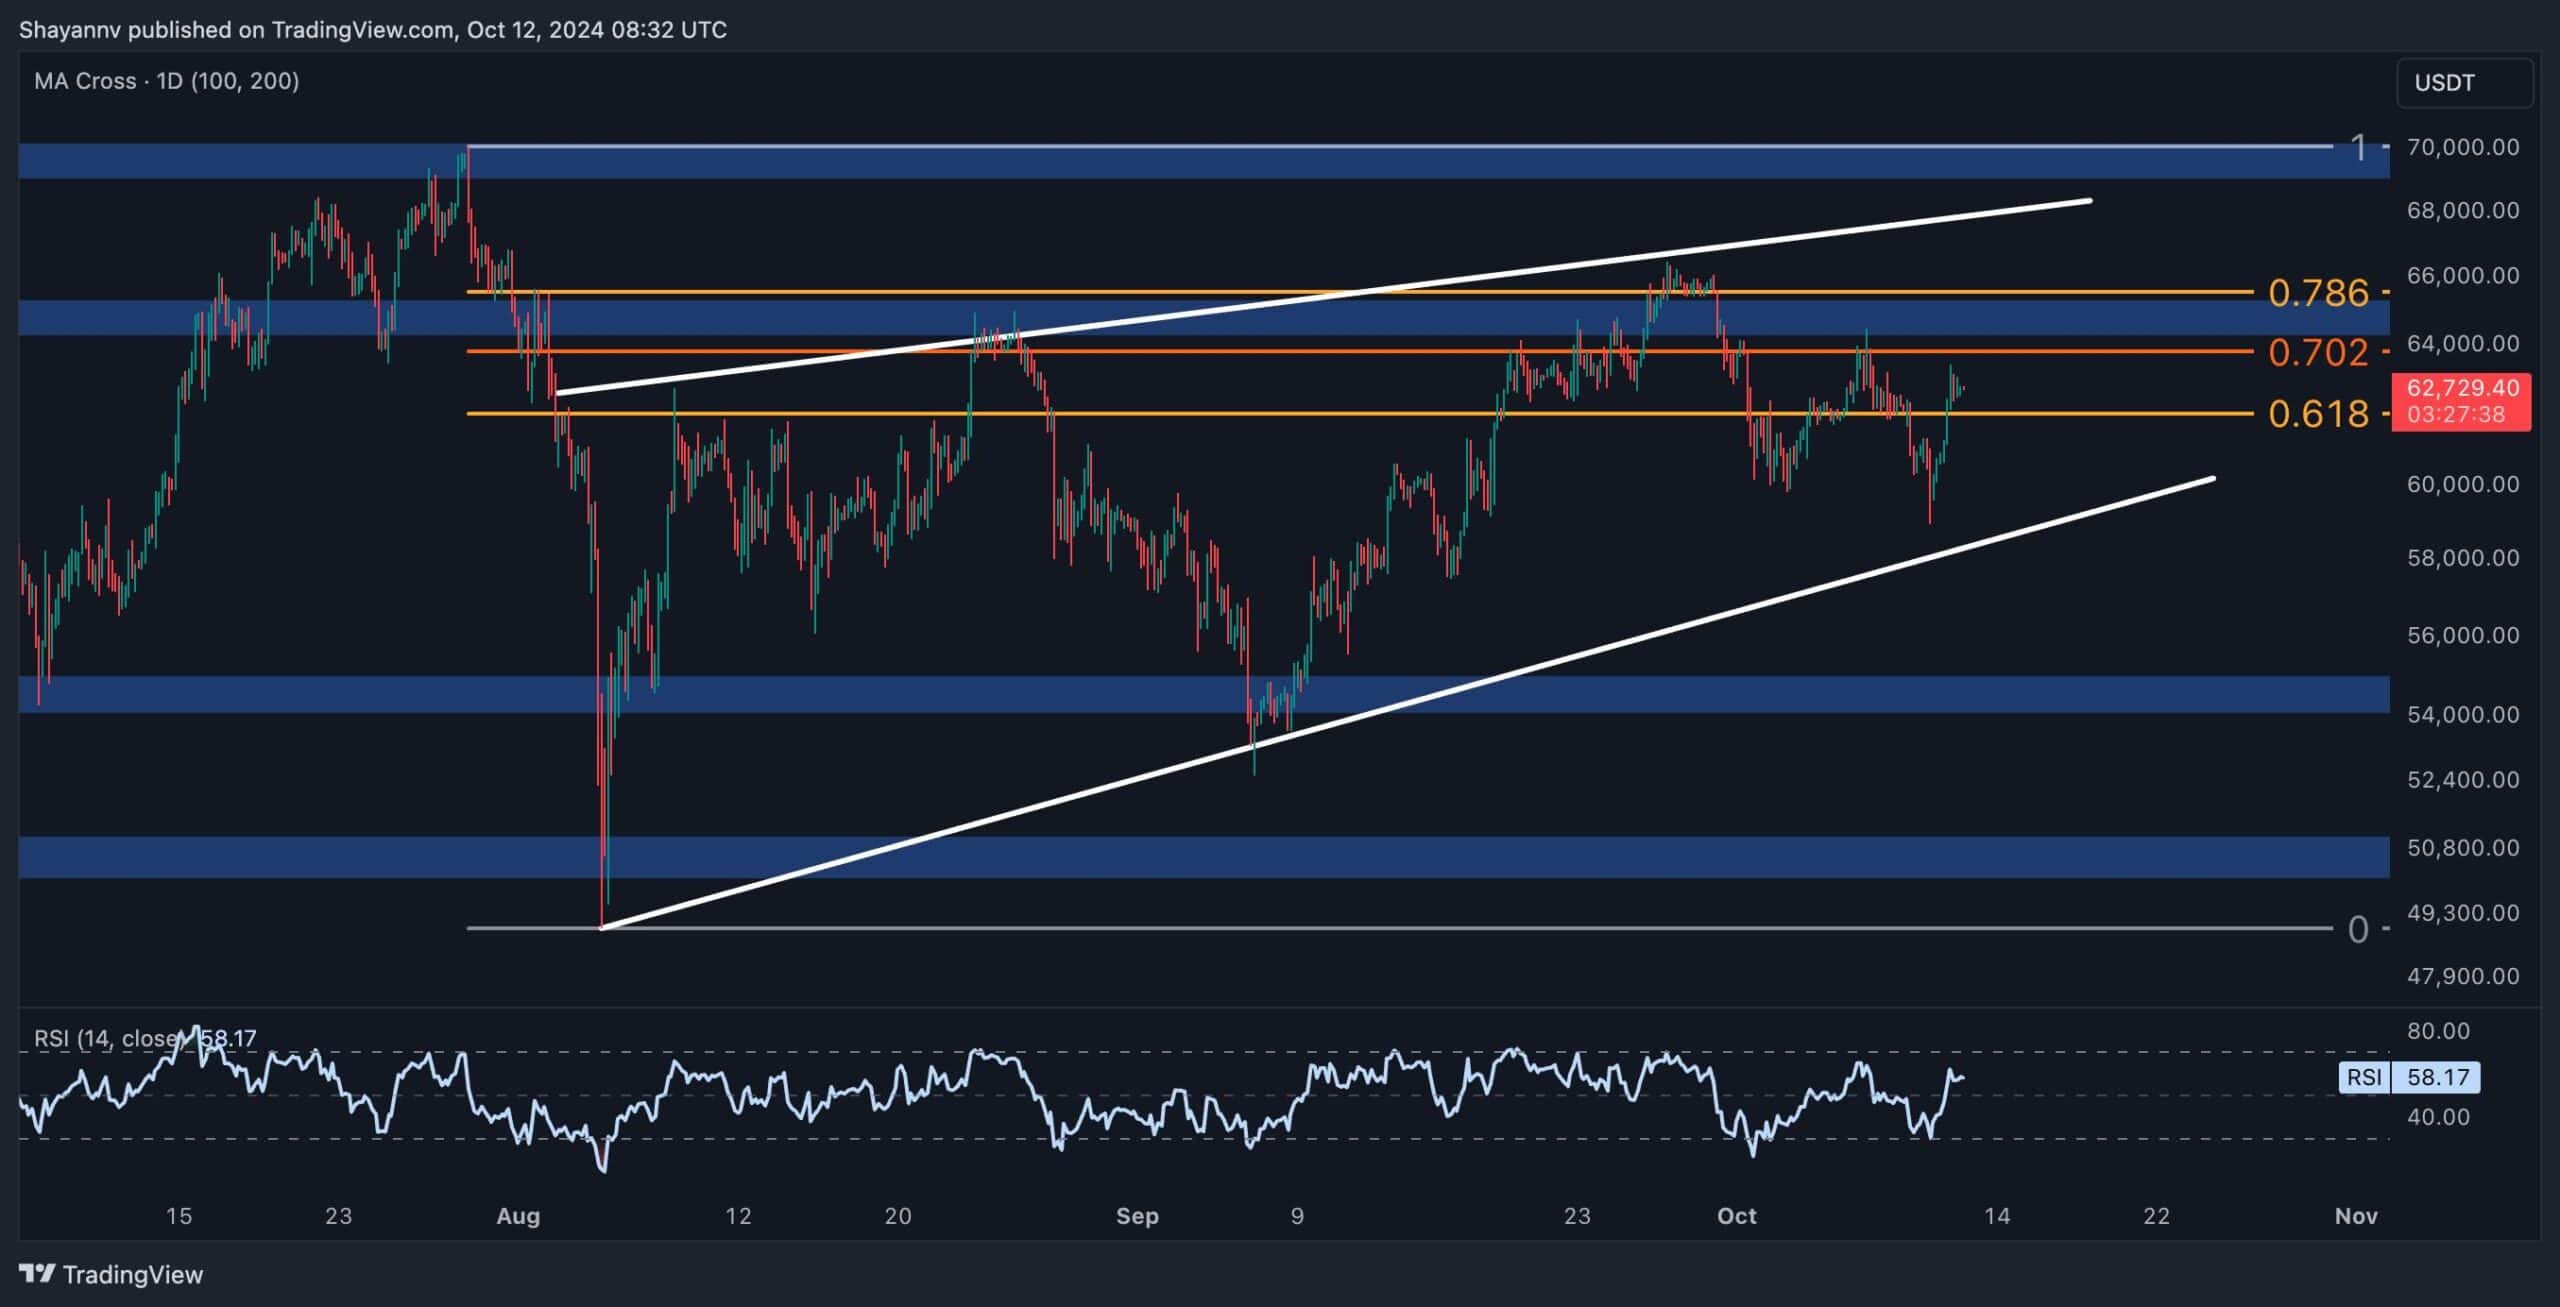
Bitcoin has been stuck in a multi-month consolidation between the $55K-$71K price range since March 2024, with no clear trend or direction emerging.
This prolonged period of sideways movement indicates an overall equilibrium between buyers and sellers, with accumulation occurring at the lower end of the range and distribution at the top. Despite this, a bearish sign has recently appeared as Bitcoin broke below the 200-day moving average at $63.4K.
However, the downward momentum was halted upon reaching the 100-day moving average at $61K, where the price has since entered a phase of low-volatility consolidation.
Bitcoin is squeezed within a narrow range, constrained by the 100-day and 200-day moving averages. This suggests that an impending breakout could determine its short-term direction. A decisive move outside this range would likely signal the next major trend.
The 4-Hour Chart
On the 4-hour chart, an ascending wedge pattern has formed during the recent prolonged consolidation phase. The price has been oscillating between this wedge’s upper and lower boundaries, which typically points to a continuation of the initial bearish trend if it breaks downward.
Following increased selling pressure near the 0.786 Fibonacci OTE level, Bitcoin experienced a significant rejection, causing the price to cascade toward the wedge’s lower boundary.
BTC is consolidating after receiving support at this level, but sellers aim to break below the wedge’s lower trendline, which coincides with the $60K support region. Should this breakdown occur, the next critical target for Bitcoin will be the $58K support region.
On-chain Analysis
By Shayan
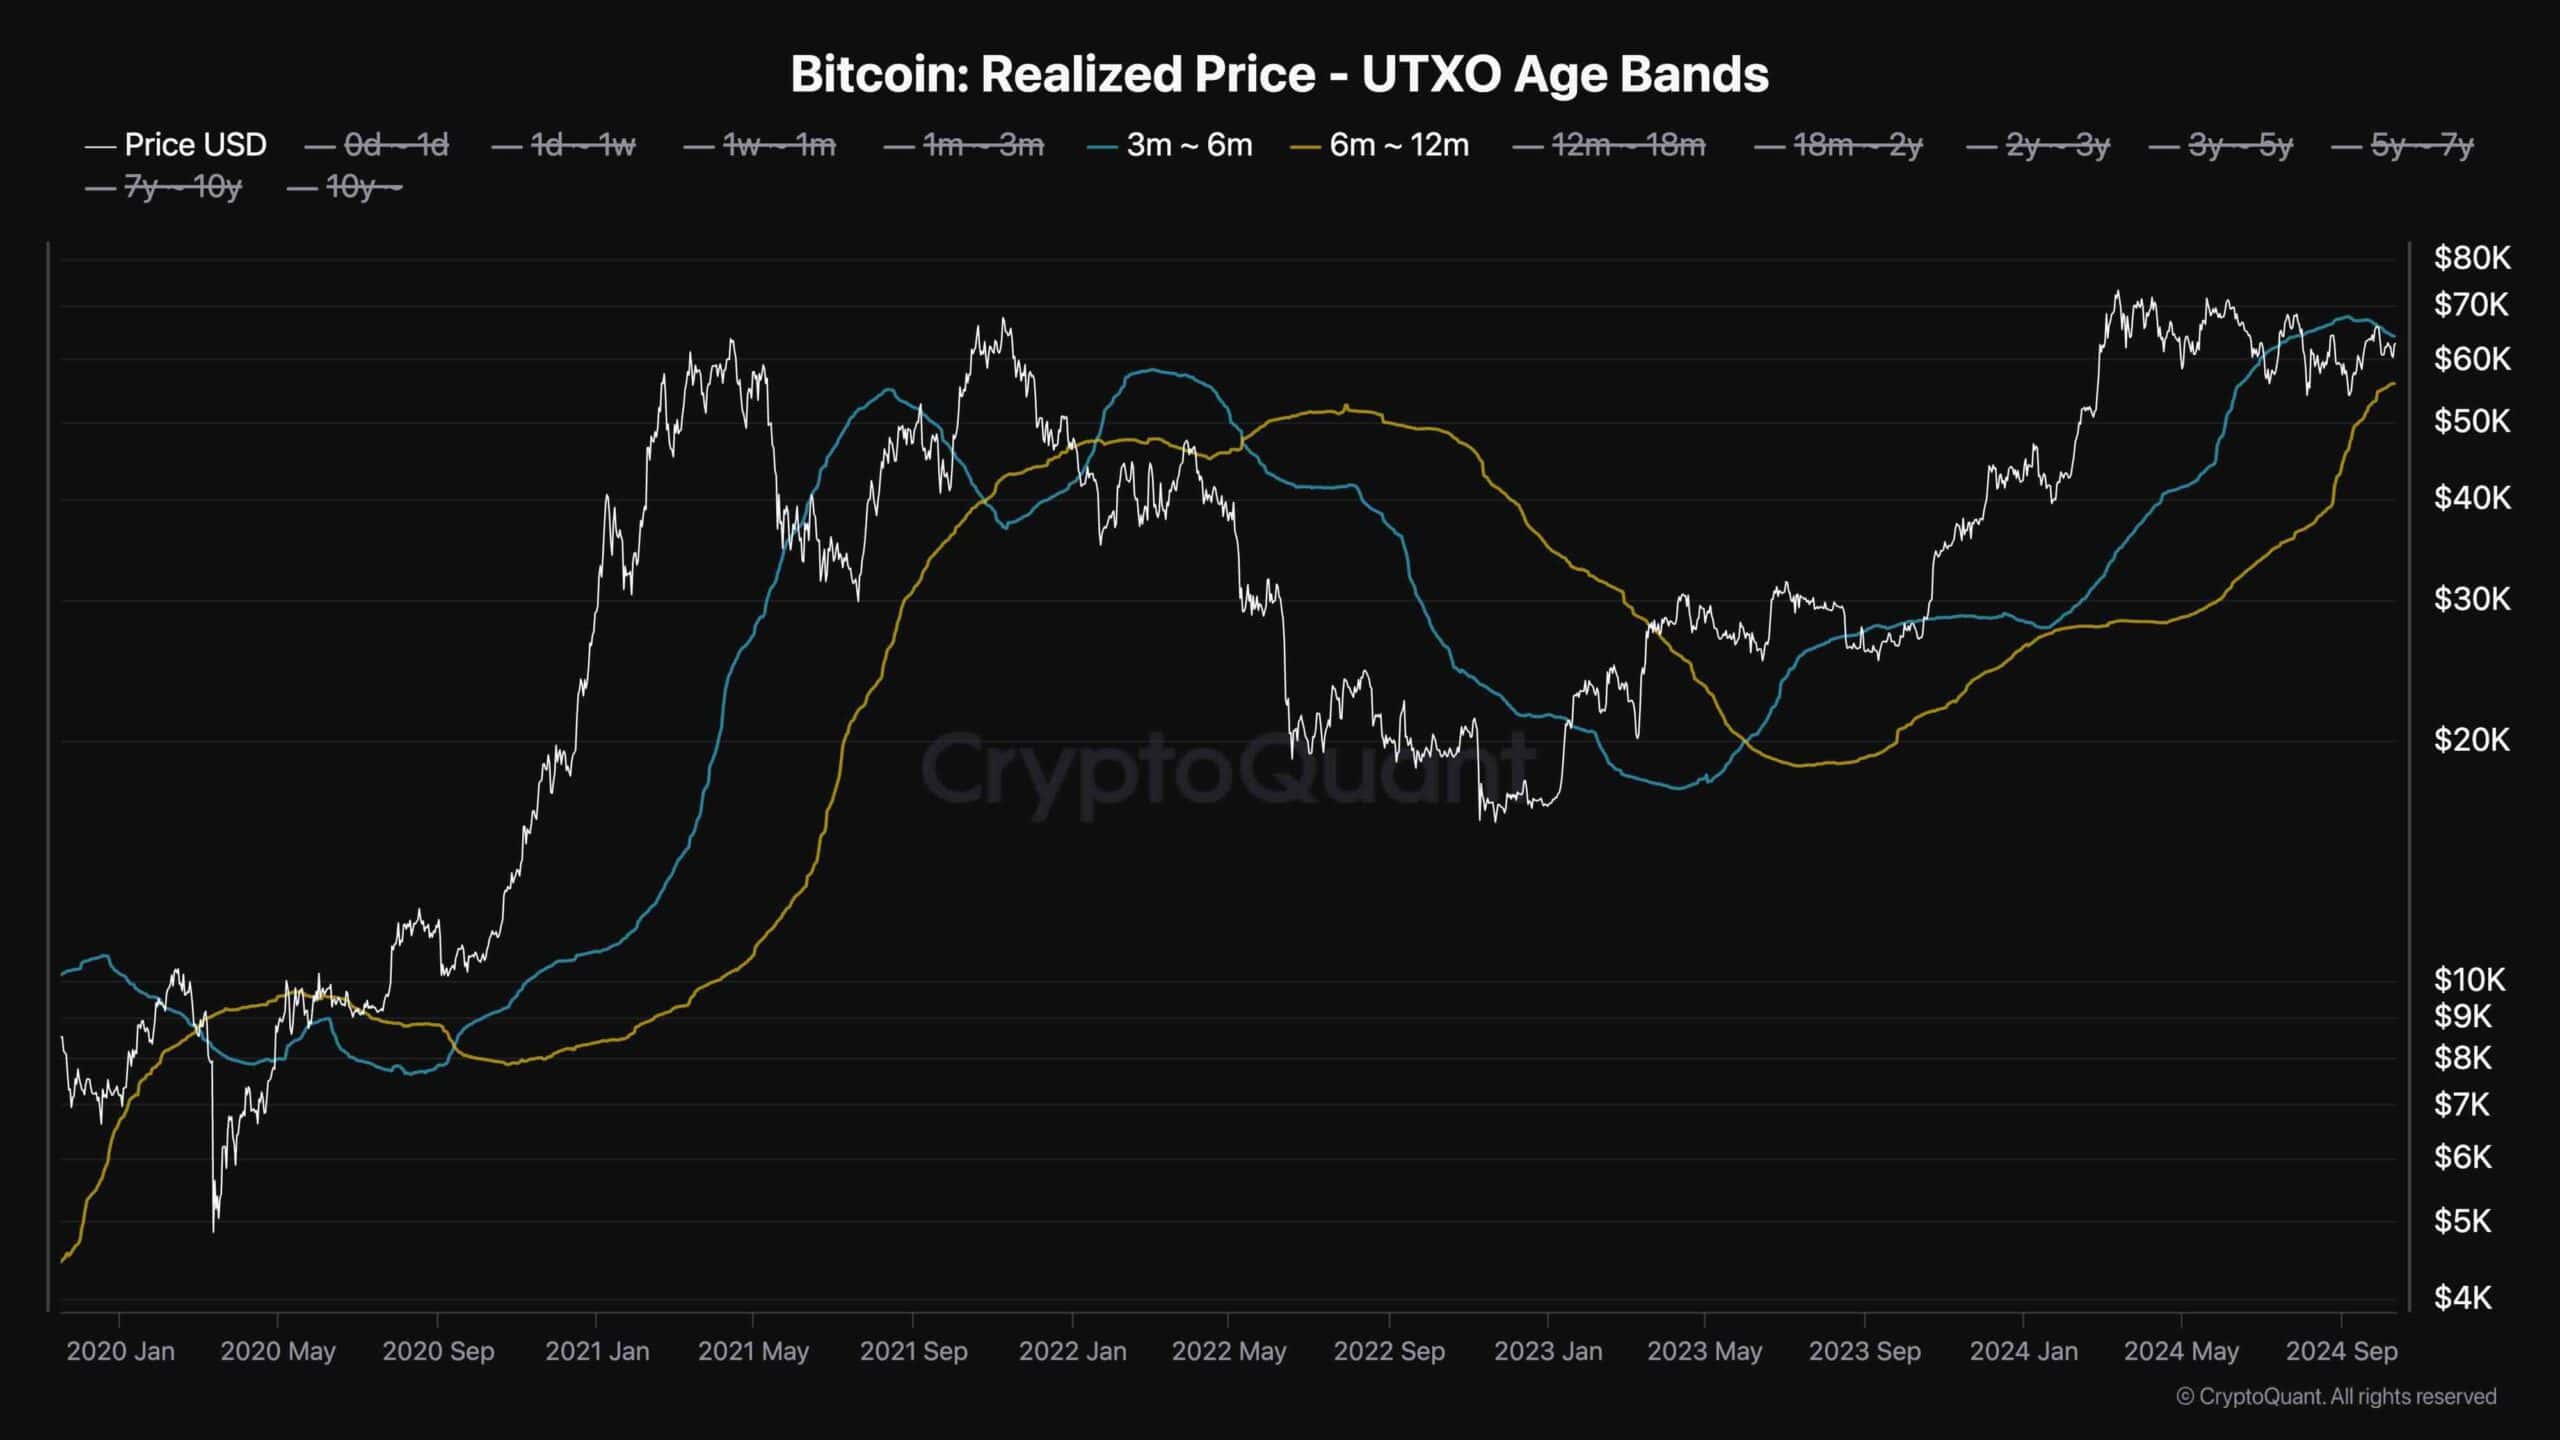
One key on-chain metric for understanding Bitcoin market behavior is the realized price UTXO age bands. This metric highlights the average price at which holders acquired their coins, broken down by how long they’ve held them.
Historically, the realized price in the 3-6 months (short-term) and 6-12 months (long-term) cohorts have served as critical support or resistance levels. When Bitcoin struggles to break above the average buy price of these groups, it often signifies a bearish trend. Conversely, if the cryptocurrency can break above this realized price, it suggests growing bullish momentum, as new buyers are willing to hold even at higher levels.
At present, Bitcoin’s price is hovering between the realized prices of these two groups:
- $64K for the short-term holders (3-6 months)
- $55K for the long-term holders (6-12 months)
Bitcoin recently surged toward the 3-6 month holders’ realized price of $64K, indicating a test of this key resistance level. A successful breakthrough above this level could signal upward momentum and potentially continue the bullish trend. However, if Bitcoin fails to break above this zone, it may suggest renewed selling pressure from short-term holders, leading to bearish retracements toward the $55K level.
The post Bitcoin Price Analysis: The 2 Most Probable Scenarios For BTC in the Short Term appeared first on CryptoPotato.
免责声明:投资有风险,本文并非投资建议,以上内容不应被视为任何金融产品的购买或出售要约、建议或邀请,作者或其他用户的任何相关讨论、评论或帖子也不应被视为此类内容。本文仅供一般参考,不考虑您的个人投资目标、财务状况或需求。TTM对信息的准确性和完整性不承担任何责任或保证,投资者应自行研究并在投资前寻求专业建议。
热议股票
- 1
- 2
- 3
- 4
- 5
- 6
- 7
- 8
- 9
- 10