Daily Market Review: BTC, ETH, APE, JUP, HNT
The bears are in control of today’s session, as seen from the decrease in the global market cap. The total cap stood at $2.34T as of press time, representing a 0.28% decrease over the last 24 hours, while the trading volume dropped by 41% over the same period to stand at $41.5B as of press time.
Bitcoin Price Review
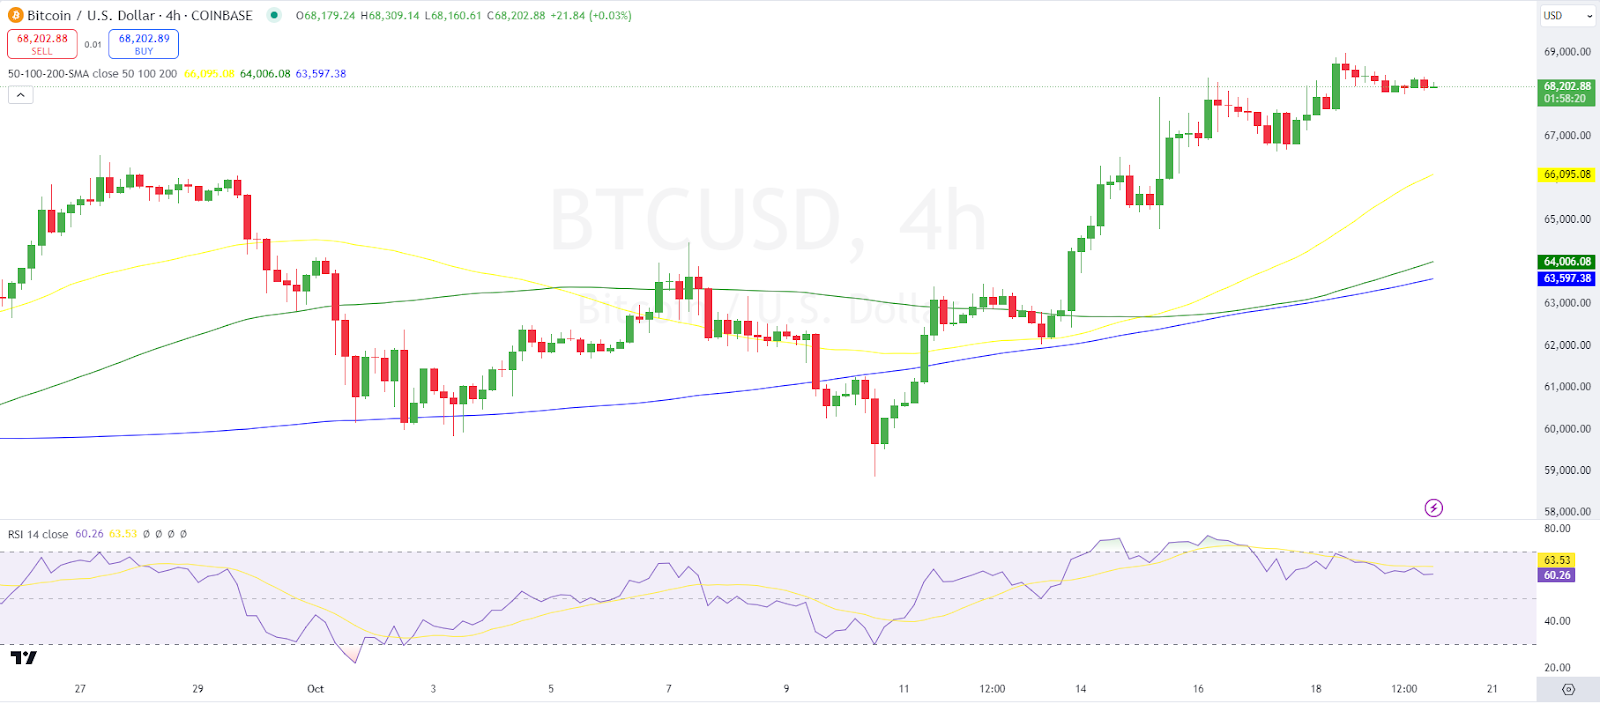
Bitcoin, $BTC, has failed to post gains in today’s session, as seen from its price movements. Looking at an in-depth analysis, we see that Bitcoin shows a solid uptrend as indicated by the price consistently staying above the moving averages (50, 100, 200-SMA). The 200-SMA (blue line) acts as strong support around $63,597.38, while the 100-SMA (green line) and the 50-SMA (yellow line) show a shorter-term upward movement.
On the other hand, we see that the Relative Strength Index (RSI) is neutral, hovering around the mid-range (60.26 to 63.53), indicating balanced buyer and seller momentum. Bitcoin traded at $68,203 as of press time, representing a 0.2% decrease over the last 24 hours.
Ethereum Price Review
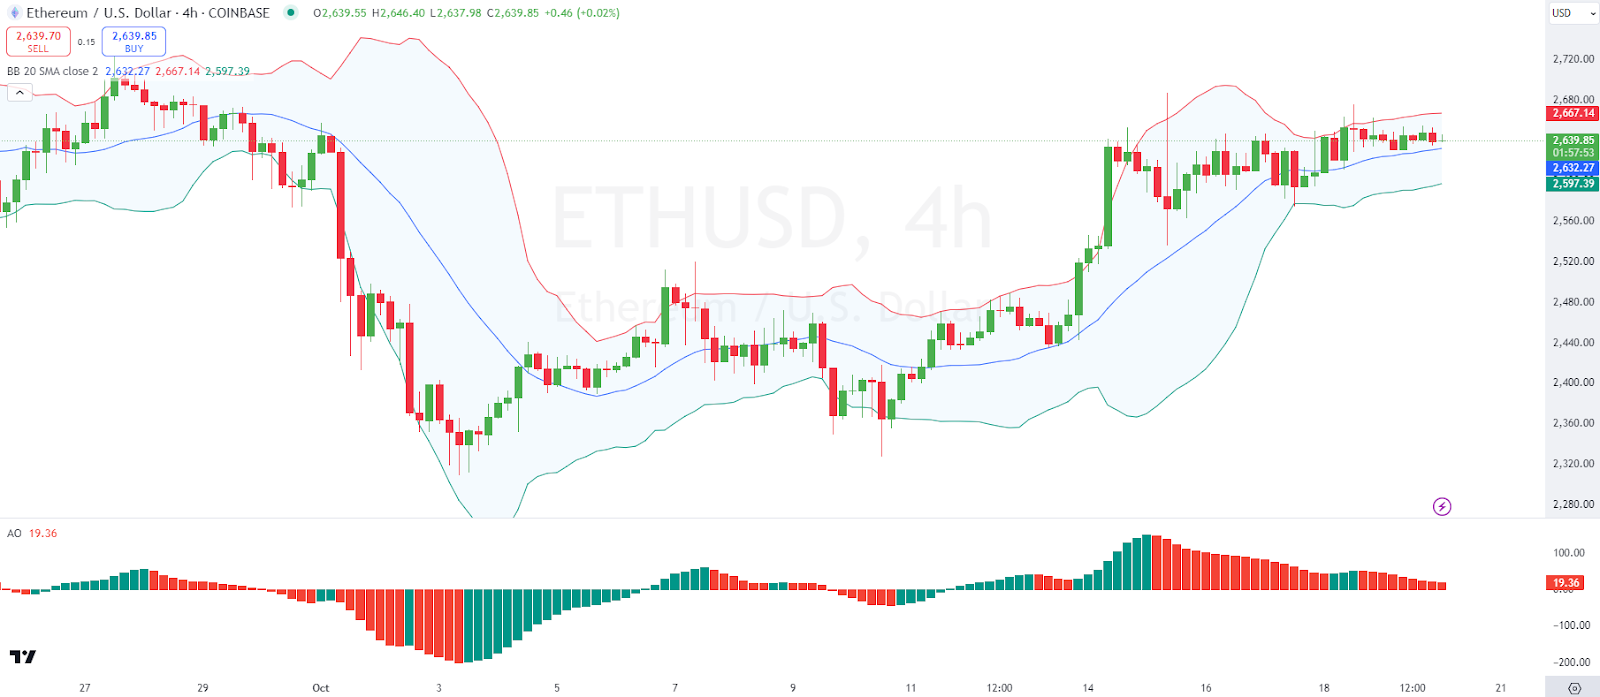
Ethereum, $ETH, has also failed to post gains in today’s session, as seen from its price movements. Looking at an in-depth analysis, we see that Ethereum displays a consolidation phase with the price moving within the Bollinger Bands without clear directional bias. The Ethereum price is capped by the upper Bollinger band around $2,667.14, suggesting immediate resistance, and supported by the middle band around $2,597.39.
On the other hand, we see that the Awesome Oscillator (AO) shows decreasing red bars, suggesting a potential loss in bearish momentum and possible bullish reversal if sustained. Ethereum traded at $2,642 as of press time, representing a 0.07% decrease over the last 24 hours.
ApeCoin Price Review
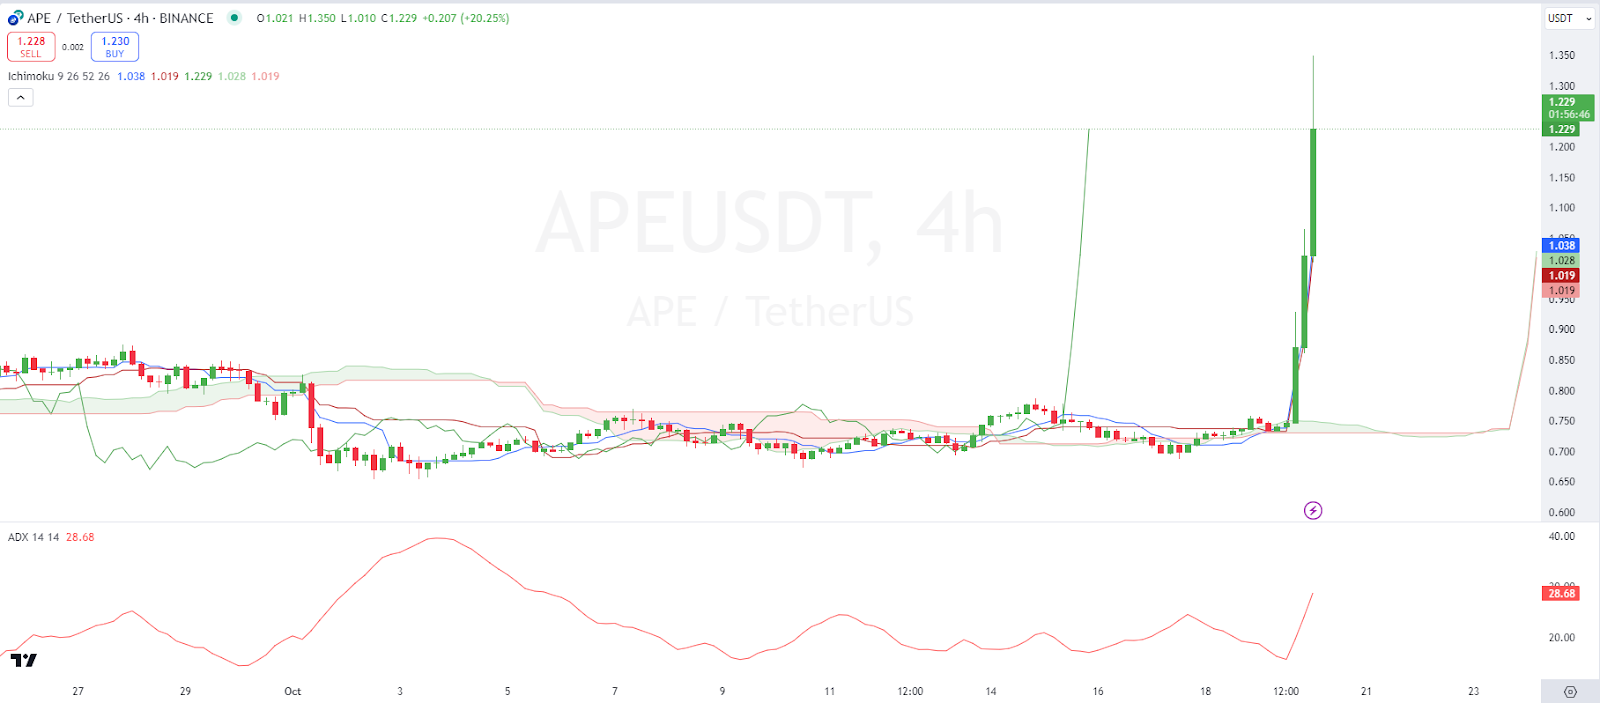
ApeCoin, $APE, is among the top gainers in today’s session as seen from its price movements. Looking at an in-depth analysis, we see a sudden vertical spike in price illustrates a sharp increase, breaking all prior resistance levels to peak at approximately $1.229. This surge suggests a high buying volume and momentum in a very short period.
On the other hand, we see that the Average Directional Index (ADX) peaks around 28.68, indicating a very strong trend associated with this sudden price movement. ApeCoin traded at $1.22 as of press time, representing a 62.8% increase over the last 24 hours.
Jupiter Price Review
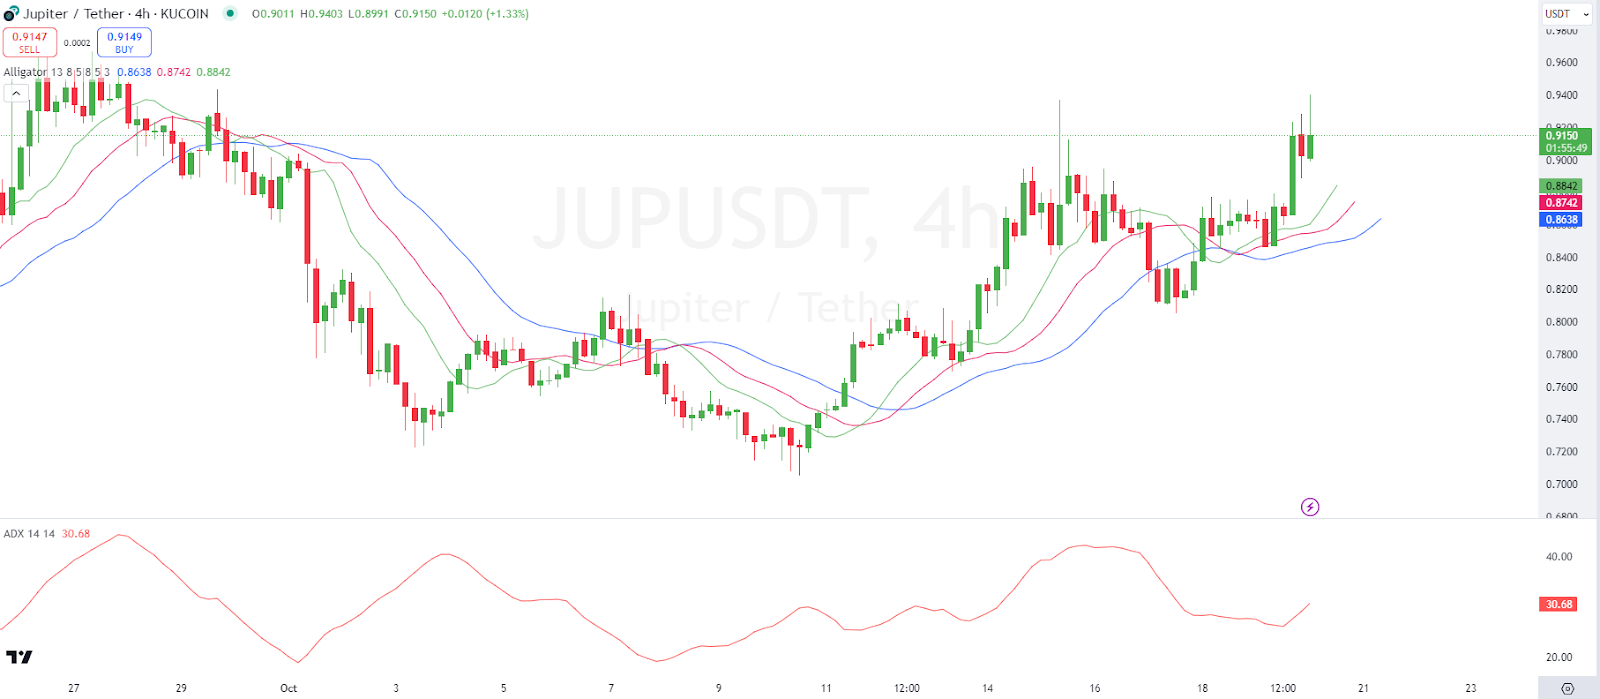
Jupiter, $JUP, is also among the top gainers in today’s session as seen from its price movements. Looking at an in-depth analysis, we see that the Jupiter price movement in this chart shows increasing bullish activity with higher highs and higher lows. Price crossing above multiple moving averages suggests a strong buying interest and bullish crossover.
Looking at other indicators, we see that the ADX on this chart indicates increasing trend strength, positioned at 30.68, pointing to a strong trend formation. Jupiter traded at $0.9161 as of press time, representing a 6.11% increase over the last 24 hours.
Helium Price Review
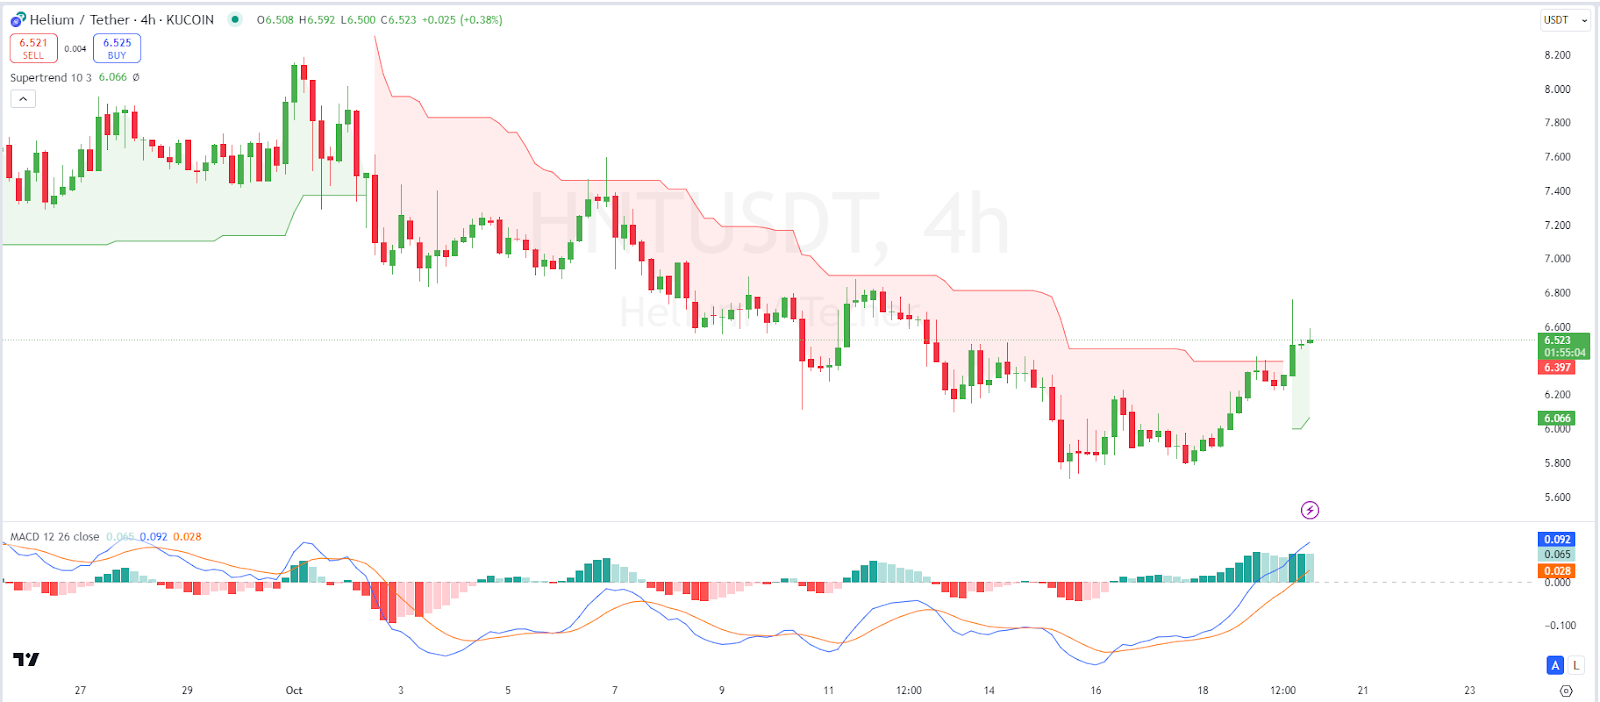
Helium, $HNT, is also among the top gainers in today’s session as seen from its price movements. Looking at an in-depth analysis, we see that the Jupiter Price has recently broken out above the upper boundary of the Supertrend indicator, turning it from red to green, signaling a bullish reversal. This breakout is accompanied by an increase in price from around $6.066 to current levels, suggesting a strong upward move.
On the other hand, we see that the MACD shows a bullish crossover, with the MACD line (blue) crossing above the signal line (orange), and the histogram turning green, indicating growing bullish momentum. Helium traded at $6.55 as of press time, representing a 2.7% increase over the last 24 hours.
免责声明:投资有风险,本文并非投资建议,以上内容不应被视为任何金融产品的购买或出售要约、建议或邀请,作者或其他用户的任何相关讨论、评论或帖子也不应被视为此类内容。本文仅供一般参考,不考虑您的个人投资目标、财务状况或需求。TTM对信息的准确性和完整性不承担任何责任或保证,投资者应自行研究并在投资前寻求专业建议。
热议股票
- 1
- 2
- 3
- 4
- 5
- 6
- 7
- 8
- 9
- 10