VEEM Ltd's (ASX:VEE) Stock's On An Uptrend: Are Strong Financials Guiding The Market?
VEEM's (ASX:VEE) stock is up by a considerable 11% over the past week. Since the market usually pay for a company’s long-term fundamentals, we decided to study the company’s key performance indicators to see if they could be influencing the market. Particularly, we will be paying attention to VEEM's ROE today.
Return on equity or ROE is a key measure used to assess how efficiently a company's management is utilizing the company's capital. In short, ROE shows the profit each dollar generates with respect to its shareholder investments.
Check out our latest analysis for VEEM
How To Calculate Return On Equity?
The formula for ROE is:
Return on Equity = Net Profit (from continuing operations) ÷ Shareholders' Equity
So, based on the above formula, the ROE for VEEM is:
13% = AU$7.0m ÷ AU$52m (Based on the trailing twelve months to June 2024).
The 'return' refers to a company's earnings over the last year. So, this means that for every A$1 of its shareholder's investments, the company generates a profit of A$0.13.
What Has ROE Got To Do With Earnings Growth?
Thus far, we have learned that ROE measures how efficiently a company is generating its profits. Depending on how much of these profits the company reinvests or "retains", and how effectively it does so, we are then able to assess a company’s earnings growth potential. Generally speaking, other things being equal, firms with a high return on equity and profit retention, have a higher growth rate than firms that don’t share these attributes.
VEEM's Earnings Growth And 13% ROE
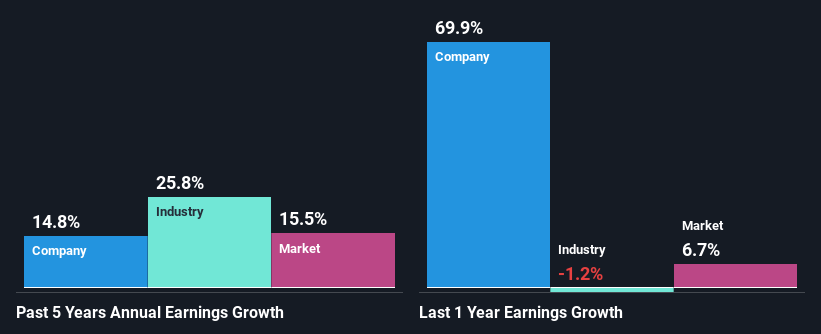
To begin with, VEEM seems to have a respectable ROE. Even when compared to the industry average of 11% the company's ROE looks quite decent. This certainly adds some context to VEEM's moderate 15% net income growth seen over the past five years.
As a next step, we compared VEEM's net income growth with the industry and were disappointed to see that the company's growth is lower than the industry average growth of 26% in the same period.
The basis for attaching value to a company is, to a great extent, tied to its earnings growth. It’s important for an investor to know whether the market has priced in the company's expected earnings growth (or decline). Doing so will help them establish if the stock's future looks promising or ominous. One good indicator of expected earnings growth is the P/E ratio which determines the price the market is willing to pay for a stock based on its earnings prospects. So, you may want to check if VEEM is trading on a high P/E or a low P/E, relative to its industry.
Is VEEM Efficiently Re-investing Its Profits?
VEEM has a healthy combination of a moderate three-year median payout ratio of 30% (or a retention ratio of 70%) and a respectable amount of growth in earnings as we saw above, meaning that the company has been making efficient use of its profits.
Moreover, VEEM is determined to keep sharing its profits with shareholders which we infer from its long history of seven years of paying a dividend. Based on the latest analysts' estimates, we found that the company's future payout ratio over the next three years is expected to hold steady at 30%. However, VEEM's ROE is predicted to rise to 19% despite there being no anticipated change in its payout ratio.
Conclusion
On the whole, we feel that VEEM's performance has been quite good. Particularly, we like that the company is reinvesting heavily into its business, and at a high rate of return. As a result, the decent growth in its earnings is not surprising. That being so, the latest analyst forecasts show that the company will continue to see an expansion in its earnings. Are these analysts expectations based on the broad expectations for the industry, or on the company's fundamentals? Click here to be taken to our analyst's forecasts page for the company.
New: Manage All Your Stock Portfolios in One Place
We've created the ultimate portfolio companion for stock investors, and it's free.
• Connect an unlimited number of Portfolios and see your total in one currency• Be alerted to new Warning Signs or Risks via email or mobile• Track the Fair Value of your stocks
Try a Demo Portfolio for FreeHave feedback on this article? Concerned about the content? Get in touch with us directly. Alternatively, email editorial-team (at) simplywallst.com.This article by Simply Wall St is general in nature. We provide commentary based on historical data and analyst forecasts only using an unbiased methodology and our articles are not intended to be financial advice. It does not constitute a recommendation to buy or sell any stock, and does not take account of your objectives, or your financial situation. We aim to bring you long-term focused analysis driven by fundamental data. Note that our analysis may not factor in the latest price-sensitive company announcements or qualitative material. Simply Wall St has no position in any stocks mentioned.
免责声明:投资有风险,本文并非投资建议,以上内容不应被视为任何金融产品的购买或出售要约、建议或邀请,作者或其他用户的任何相关讨论、评论或帖子也不应被视为此类内容。本文仅供一般参考,不考虑您的个人投资目标、财务状况或需求。TTM对信息的准确性和完整性不承担任何责任或保证,投资者应自行研究并在投资前寻求专业建议。
热议股票
- 1
- 2
- 3
- 4
- 5
- 6
- 7
- 8
- 9
- 10