Calculating The Intrinsic Value Of Neuren Pharmaceuticals Limited (ASX:NEU)
Key Insights
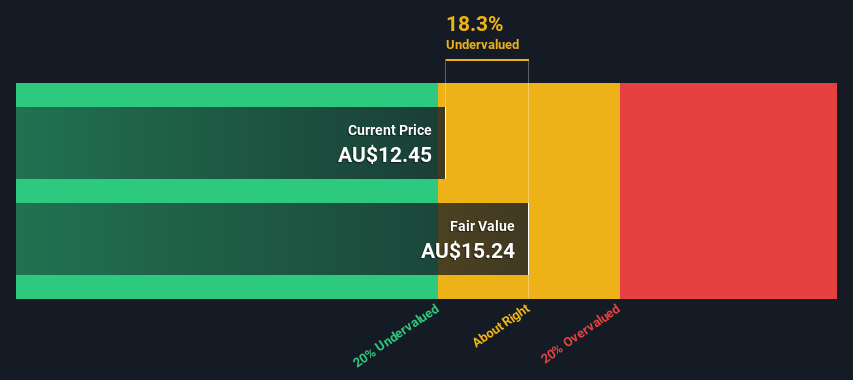
- Neuren Pharmaceuticals' estimated fair value is AU$15.24 based on 2 Stage Free Cash Flow to Equity
- Neuren Pharmaceuticals' AU$12.45 share price indicates it is trading at similar levels as its fair value estimate
- The AU$26.56 analyst price target for NEU is 74% more than our estimate of fair value
Today we will run through one way of estimating the intrinsic value of Neuren Pharmaceuticals Limited (ASX:NEU) by estimating the company's future cash flows and discounting them to their present value. We will use the Discounted Cash Flow (DCF) model on this occasion. It may sound complicated, but actually it is quite simple!
Remember though, that there are many ways to estimate a company's value, and a DCF is just one method. If you want to learn more about discounted cash flow, the rationale behind this calculation can be read in detail in the Simply Wall St analysis model.
View our latest analysis for Neuren Pharmaceuticals
The Calculation
We're using the 2-stage growth model, which simply means we take in account two stages of company's growth. In the initial period the company may have a higher growth rate and the second stage is usually assumed to have a stable growth rate. To begin with, we have to get estimates of the next ten years of cash flows. Where possible we use analyst estimates, but when these aren't available we extrapolate the previous free cash flow (FCF) from the last estimate or reported value. We assume companies with shrinking free cash flow will slow their rate of shrinkage, and that companies with growing free cash flow will see their growth rate slow, over this period. We do this to reflect that growth tends to slow more in the early years than it does in later years.
A DCF is all about the idea that a dollar in the future is less valuable than a dollar today, and so the sum of these future cash flows is then discounted to today's value:
10-year free cash flow (FCF) estimate
| 2025 | 2026 | 2027 | 2028 | 2029 | 2030 | 2031 | 2032 | 2033 | 2034 | |
| Levered FCF (A$, Millions) | AU$123.1m | AU$99.6m | AU$86.8m | AU$79.6m | AU$75.5m | AU$73.4m | AU$72.5m | AU$72.4m | AU$72.8m | AU$73.6m |
| Growth Rate Estimate Source | Analyst x3 | Analyst x2 | Est @ -12.88% | Est @ -8.29% | Est @ -5.08% | Est @ -2.83% | Est @ -1.26% | Est @ -0.16% | Est @ 0.61% | Est @ 1.15% |
| Present Value (A$, Millions) Discounted @ 5.7% | AU$116 | AU$89.1 | AU$73.5 | AU$63.7 | AU$57.2 | AU$52.6 | AU$49.1 | AU$46.4 | AU$44.2 | AU$42.3 |
("Est" = FCF growth rate estimated by Simply Wall St)Present Value of 10-year Cash Flow (PVCF) = AU$635m
The second stage is also known as Terminal Value, this is the business's cash flow after the first stage. For a number of reasons a very conservative growth rate is used that cannot exceed that of a country's GDP growth. In this case we have used the 5-year average of the 10-year government bond yield (2.4%) to estimate future growth. In the same way as with the 10-year 'growth' period, we discount future cash flows to today's value, using a cost of equity of 5.7%.
Terminal Value (TV)= FCF2034 × (1 + g) ÷ (r – g) = AU$74m× (1 + 2.4%) ÷ (5.7%– 2.4%) = AU$2.3b
Present Value of Terminal Value (PVTV)= TV / (1 + r)10= AU$2.3b÷ ( 1 + 5.7%)10= AU$1.3b
The total value, or equity value, is then the sum of the present value of the future cash flows, which in this case is AU$1.9b. To get the intrinsic value per share, we divide this by the total number of shares outstanding. Compared to the current share price of AU$12.5, the company appears about fair value at a 18% discount to where the stock price trades currently. The assumptions in any calculation have a big impact on the valuation, so it is better to view this as a rough estimate, not precise down to the last cent.
Important Assumptions
The calculation above is very dependent on two assumptions. The first is the discount rate and the other is the cash flows. If you don't agree with these result, have a go at the calculation yourself and play with the assumptions. The DCF also does not consider the possible cyclicality of an industry, or a company's future capital requirements, so it does not give a full picture of a company's potential performance. Given that we are looking at Neuren Pharmaceuticals as potential shareholders, the cost of equity is used as the discount rate, rather than the cost of capital (or weighted average cost of capital, WACC) which accounts for debt. In this calculation we've used 5.7%, which is based on a levered beta of 0.800. Beta is a measure of a stock's volatility, compared to the market as a whole. We get our beta from the industry average beta of globally comparable companies, with an imposed limit between 0.8 and 2.0, which is a reasonable range for a stable business.
SWOT Analysis for Neuren Pharmaceuticals
- Earnings growth over the past year exceeded the industry.
- Currently debt free.
- Balance sheet summary for NEU.
- No major weaknesses identified for NEU.
- Annual earnings are forecast to grow for the next 3 years.
- Good value based on P/E ratio and estimated fair value.
- Annual earnings are forecast to grow slower than the Australian market.
- What else are analysts forecasting for NEU?
Moving On:
Whilst important, the DCF calculation ideally won't be the sole piece of analysis you scrutinize for a company. DCF models are not the be-all and end-all of investment valuation. Instead the best use for a DCF model is to test certain assumptions and theories to see if they would lead to the company being undervalued or overvalued. For instance, if the terminal value growth rate is adjusted slightly, it can dramatically alter the overall result. For Neuren Pharmaceuticals, we've compiled three important aspects you should further examine:
- Financial Health: Does NEU have a healthy balance sheet? Take a look at our free balance sheet analysis with six simple checks on key factors like leverage and risk.
- Management:Have insiders been ramping up their shares to take advantage of the market's sentiment for NEU's future outlook? Check out our management and board analysis with insights on CEO compensation and governance factors.
- Other Solid Businesses: Low debt, high returns on equity and good past performance are fundamental to a strong business. Why not explore our interactive list of stocks with solid business fundamentals to see if there are other companies you may not have considered!
PS. The Simply Wall St app conducts a discounted cash flow valuation for every stock on the ASX every day. If you want to find the calculation for other stocks just search here.
Valuation is complex, but we're here to simplify it.
Discover if Neuren Pharmaceuticals might be undervalued or overvalued with our detailed analysis, featuring fair value estimates, potential risks, dividends, insider trades, and its financial condition.
Access Free AnalysisHave feedback on this article? Concerned about the content? Get in touch with us directly. Alternatively, email editorial-team (at) simplywallst.com.This article by Simply Wall St is general in nature. We provide commentary based on historical data and analyst forecasts only using an unbiased methodology and our articles are not intended to be financial advice. It does not constitute a recommendation to buy or sell any stock, and does not take account of your objectives, or your financial situation. We aim to bring you long-term focused analysis driven by fundamental data. Note that our analysis may not factor in the latest price-sensitive company announcements or qualitative material. Simply Wall St has no position in any stocks mentioned.
免责声明:投资有风险,本文并非投资建议,以上内容不应被视为任何金融产品的购买或出售要约、建议或邀请,作者或其他用户的任何相关讨论、评论或帖子也不应被视为此类内容。本文仅供一般参考,不考虑您的个人投资目标、财务状况或需求。TTM对信息的准确性和完整性不承担任何责任或保证,投资者应自行研究并在投资前寻求专业建议。
热议股票
- 1
- 2
- 3
- 4
- 5
- 6
- 7
- 8
- 9
- 10