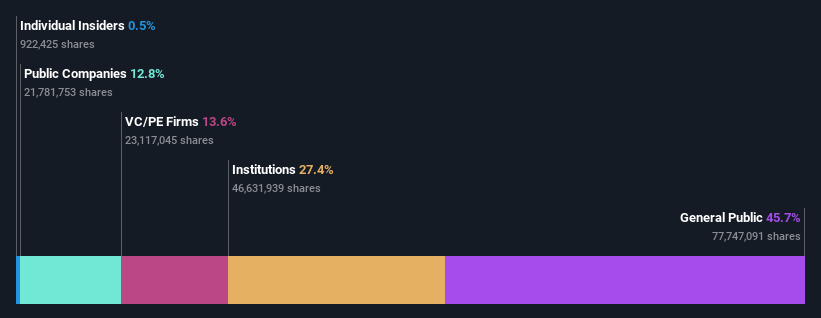
Institutions along with retail investors who hold considerable shares inSeres Therapeutics, Inc. (NASDAQ:MCRB) come under pressure; lose 17% of holdings value
Key Insights
- The considerable ownership by retail investors in Seres Therapeutics indicates that they collectively have a greater say in management and business strategy
- The top 13 shareholders own 50% of the company
- Institutional ownership in Seres Therapeutics is 27%
Every investor in Seres Therapeutics, Inc. (NASDAQ:MCRB) should be aware of the most powerful shareholder groups. The group holding the most number of shares in the company, around 46% to be precise, is retail investors. In other words, the group stands to gain the most (or lose the most) from their investment into the company.
While institutions who own 27% came under pressure after market cap dropped to US$121m last week,retail investors took the most losses.
Let's delve deeper into each type of owner of Seres Therapeutics, beginning with the chart below.
View our latest analysis for Seres Therapeutics
What Does The Institutional Ownership Tell Us About Seres Therapeutics?
Many institutions measure their performance against an index that approximates the local market. So they usually pay more attention to companies that are included in major indices.
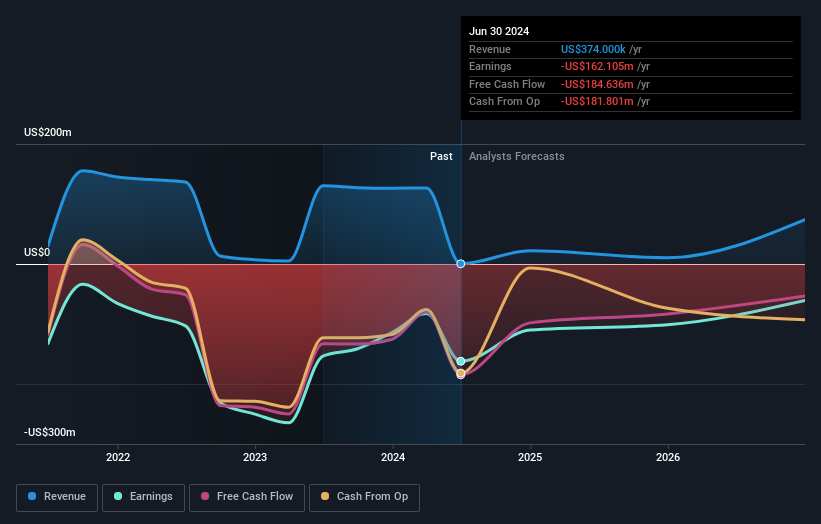
Seres Therapeutics already has institutions on the share registry. Indeed, they own a respectable stake in the company. This implies the analysts working for those institutions have looked at the stock and they like it. But just like anyone else, they could be wrong. If multiple institutions change their view on a stock at the same time, you could see the share price drop fast. It's therefore worth looking at Seres Therapeutics' earnings history below. Of course, the future is what really matters.
We note that hedge funds don't have a meaningful investment in Seres Therapeutics. The company's largest shareholder is Flagship Pioneering, Inc, with ownership of 14%. For context, the second largest shareholder holds about 13% of the shares outstanding, followed by an ownership of 13% by the third-largest shareholder.
After doing some more digging, we found that the top 13 have the combined ownership of 50% in the company, suggesting that no single shareholder has significant control over the company.
Researching institutional ownership is a good way to gauge and filter a stock's expected performance. The same can be achieved by studying analyst sentiments. Quite a few analysts cover the stock, so you could look into forecast growth quite easily.
Insider Ownership Of Seres Therapeutics
The definition of an insider can differ slightly between different countries, but members of the board of directors always count. The company management answer to the board and the latter should represent the interests of shareholders. Notably, sometimes top-level managers are on the board themselves.
I generally consider insider ownership to be a good thing. However, on some occasions it makes it more difficult for other shareholders to hold the board accountable for decisions.
Our most recent data indicates that insiders own less than 1% of Seres Therapeutics, Inc.. It appears that the board holds about US$655k worth of stock. This compares to a market capitalization of US$121m. Many investors in smaller companies prefer to see the board more heavily invested. You can click here to see if those insiders have been buying or selling.
General Public Ownership
The general public-- including retail investors -- own 46% stake in the company, and hence can't easily be ignored. This size of ownership, while considerable, may not be enough to change company policy if the decision is not in sync with other large shareholders.
Private Equity Ownership
With a stake of 14%, private equity firms could influence the Seres Therapeutics board. Sometimes we see private equity stick around for the long term, but generally speaking they have a shorter investment horizon and -- as the name suggests -- don't invest in public companies much. After some time they may look to sell and redeploy capital elsewhere.
Public Company Ownership
It appears to us that public companies own 13% of Seres Therapeutics. We can't be certain but it is quite possible this is a strategic stake. The businesses may be similar, or work together.
Next Steps:
I find it very interesting to look at who exactly owns a company. But to truly gain insight, we need to consider other information, too. Like risks, for instance. Every company has them, and we've spotted 5 warning signs for Seres Therapeutics (of which 2 are concerning!) you should know about.
Ultimately the future is most important. You can access this free report on analyst forecasts for the company.
NB: Figures in this article are calculated using data from the last twelve months, which refer to the 12-month period ending on the last date of the month the financial statement is dated. This may not be consistent with full year annual report figures.
New: Manage All Your Stock Portfolios in One Place
We've created the ultimate portfolio companion for stock investors, and it's free.
• Connect an unlimited number of Portfolios and see your total in one currency• Be alerted to new Warning Signs or Risks via email or mobile• Track the Fair Value of your stocks
Try a Demo Portfolio for FreeHave feedback on this article? Concerned about the content? Get in touch with us directly. Alternatively, email editorial-team (at) simplywallst.com.This article by Simply Wall St is general in nature. We provide commentary based on historical data and analyst forecasts only using an unbiased methodology and our articles are not intended to be financial advice. It does not constitute a recommendation to buy or sell any stock, and does not take account of your objectives, or your financial situation. We aim to bring you long-term focused analysis driven by fundamental data. Note that our analysis may not factor in the latest price-sensitive company announcements or qualitative material. Simply Wall St has no position in any stocks mentioned.
免责声明:投资有风险,本文并非投资建议,以上内容不应被视为任何金融产品的购买或出售要约、建议或邀请,作者或其他用户的任何相关讨论、评论或帖子也不应被视为此类内容。本文仅供一般参考,不考虑您的个人投资目标、财务状况或需求。TTM对信息的准确性和完整性不承担任何责任或保证,投资者应自行研究并在投资前寻求专业建议。
热议股票
- 1
- 2
- 3
- 4
- 5
- 6
- 7
- 8
- 9
- 10