When November starts, so does the best 6 months for large- and small-cap stocks

deepblue4you
While many investors start thinking about the year-end in November, the month also kickstarts what’s usually the best six-month stretch for the U.S. stock market for returns for the S&P 500 (SP500) and the Russell 2000 (RTY).
CFRA highlighted the 7% average return for the S&P 500 (SP500) during November through the end of April (N-A), running back to World War II. That figure compares with the 2% average return from May through October (M-O).
For the small-cap Russell 2000 index (RTY), the average return is 6.8% in N-A versus 0.7% in M-O.
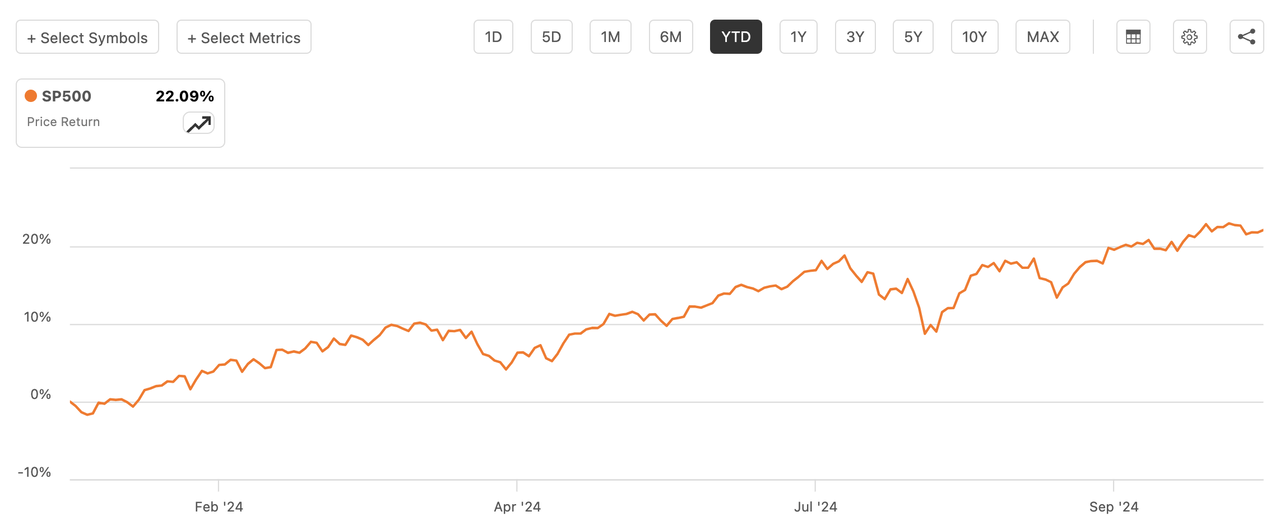
The S&P 500 (SP500) “didn’t miss a beat” this year in rising nearly 16% from the end of April until Monday’s session after climbing 20% in the previous N-A run, CFRA Chief Investment Strategist Sam Stovall said in his research note Monday.
“This double-dose of double-digit returns has caused investors to wonder if the market has used up its energy reserves and may be headed for tough times,” he said. “Not according to history, which says, but does not guarantee, that prior momentum typically served as a running start to the following N-A period," Stovall said.
The benchmark (SP500) in the prior 12 times it’s risen at least 10% during M-O, the market has gained an average of 13% in the subsequent N-A period, at a 92% frequency rate, he said. Stovall hat-tipped Stock Trader’s Almanac for dubbing N-A as the “best six months” for the S&P 500 (SP500) as that's when it logs the highest average price return and frequency of advance over other rolling six-month periods.
Since 1990, the Consumer Discretionary (XLY), Industrials (XLI), Materials (XLB), and Technology (XLK) sectors together have posted a 9.3% average return, higher than the 7.1% average for the S&P 500 (SP500).
Stovall listed representative companies from S&P 500 (SP500) sub-industries with the highest N-A returns:
- Applied Materials (AMAT)
- Meritage Homes (MTH)
- MGM Resorts International (MGM)
- Valero (VLO)
- Paccar (PCAR)
- Carpenter Technology (CRS)
- Abercrombie & Fitch Co. (ANF)
- AECOM (ACM)
For investors who want to track the S&P 500 (SP500) via ETFs, here are a few: (VOO), (RSP), (SPY), (SH) and (UPRO).
免责声明:投资有风险,本文并非投资建议,以上内容不应被视为任何金融产品的购买或出售要约、建议或邀请,作者或其他用户的任何相关讨论、评论或帖子也不应被视为此类内容。本文仅供一般参考,不考虑您的个人投资目标、财务状况或需求。TTM对信息的准确性和完整性不承担任何责任或保证,投资者应自行研究并在投资前寻求专业建议。
热议股票
- 1
- 2
- 3
- 4
- 5
- 6
- 7
- 8
- 9
- 10