3 Stocks That May Offer Value Opportunities In October 2024
As global markets navigate the pressures of rising U.S. Treasury yields and a cautious economic outlook, investors are keenly observing shifts in major indices like the S&P 500 and Nasdaq Composite. Amidst these fluctuations, identifying undervalued stocks can present potential opportunities for those looking to capitalize on market inefficiencies. In such an environment, a good stock is often characterized by strong fundamentals and resilience against broader economic headwinds, making it an attractive consideration for value-focused investors.
Top 10 Undervalued Stocks Based On Cash Flows
| Name | Current Price | Fair Value (Est) | Discount (Est) |
| J.K. Cement (BSE:532644) | ₹4348.90 | ₹8670.14 | 49.8% |
| Proya CosmeticsLtd (SHSE:603605) | CN¥96.39 | CN¥192.67 | 50% |
| Lindab International (OM:LIAB) | SEK227.40 | SEK453.69 | 49.9% |
| California Resources (NYSE:CRC) | US$52.09 | US$104.09 | 50% |
| Super Group (JSE:SPG) | ZAR23.21 | ZAR46.16 | 49.7% |
| WEX (NYSE:WEX) | US$173.16 | US$346.09 | 50% |
| Foxtons Group (LSE:FOXT) | £0.594 | £1.19 | 49.9% |
| Energy One (ASX:EOL) | A$5.53 | A$11.04 | 49.9% |
| Mercari (TSE:4385) | ¥2101.50 | ¥4179.64 | 49.7% |
| Sinch (OM:SINCH) | SEK31.33 | SEK62.49 | 49.9% |
Click here to see the full list of 951 stocks from our Undervalued Stocks Based On Cash Flows screener.
Here's a peek at a few of the choices from the screener.
BYD Electronic (International) (SEHK:285)
Overview: BYD Electronic (International) Company Limited is an investment holding company that focuses on the design, manufacture, assembly, and sale of mobile handset components and modules in China and globally, with a market cap of HK$78.52 billion.
Operations: The company's revenue primarily comes from the manufacture, assembly, and sale of mobile handset components and modules, generating CN¥152.36 billion.
Estimated Discount To Fair Value: 48.8%
BYD Electronic (International) is trading at HK$34.85, significantly below its estimated fair value of HK$68.1, suggesting it may be undervalued based on cash flows. The company's earnings are forecasted to grow significantly at 24.9% annually over the next three years, outpacing the Hong Kong market's growth rate of 12.3%. However, revenue growth is slower than desired at 12% per year and return on equity is expected to remain low at 16.8%.
- The growth report we've compiled suggests that BYD Electronic (International)'s future prospects could be on the up.
- Unlock comprehensive insights into our analysis of BYD Electronic (International) stock in this financial health report.

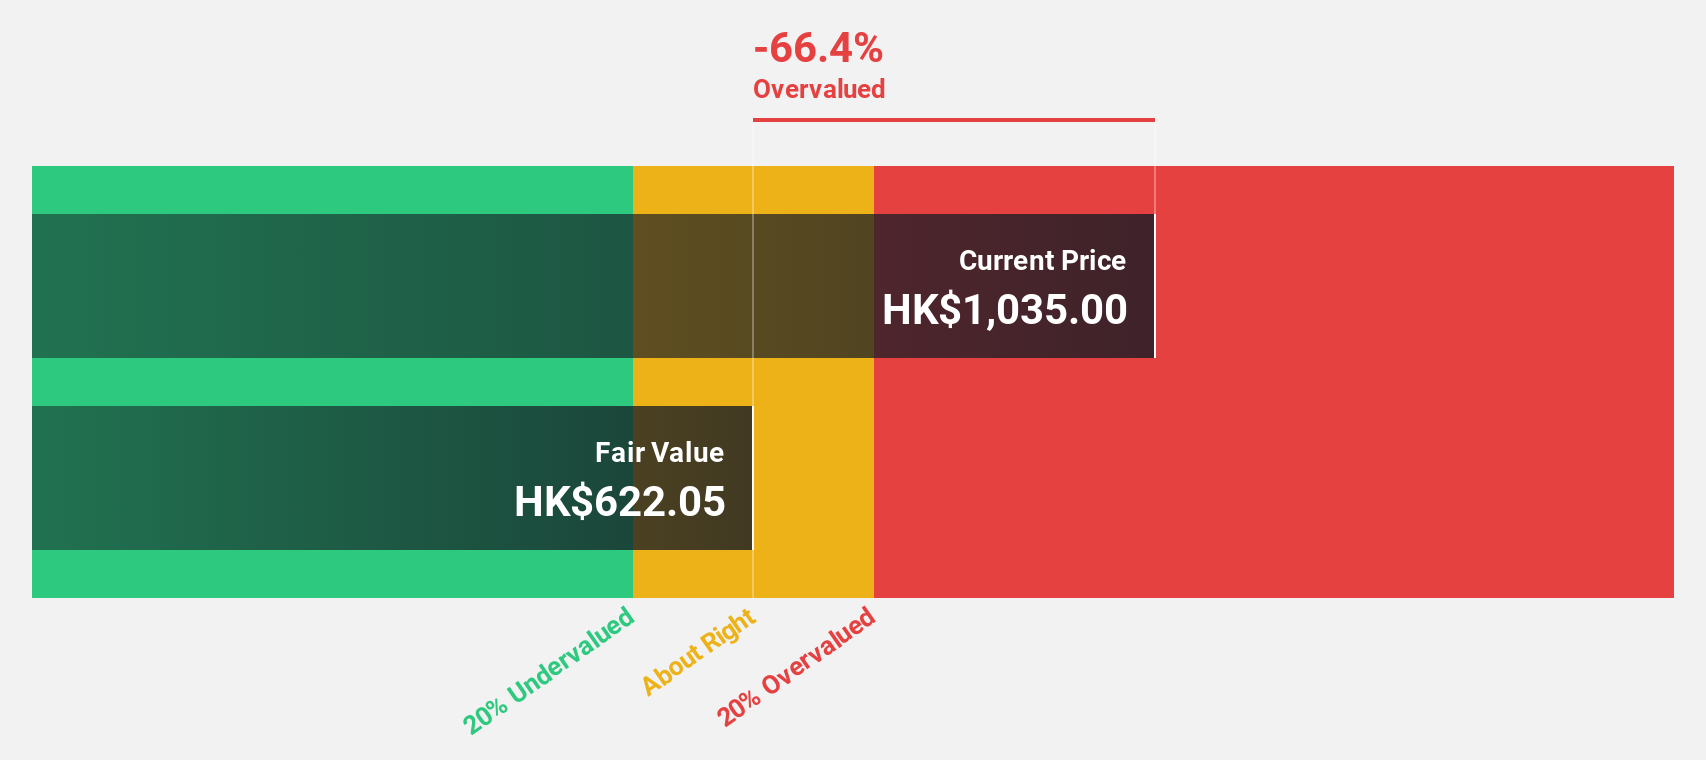
Laopu Gold (SEHK:6181)
Overview: Laopu Gold Co., Ltd. designs, manufactures, and sells jewelry products in Mainland China, Hong Kong, and Macau with a market capitalization of approximately HK$36.20 billion.
Operations: The company's revenue primarily comes from its Jewelry & Watches segment, which generated CN¥5.28 billion.
Estimated Discount To Fair Value: 30.1%
Laopu Gold is trading at HK$215, considerably below the estimated fair value of HK$307.44, highlighting potential undervaluation based on cash flows. The company reported substantial earnings growth with net income rising to CNY 587.81 million from CNY 196.75 million year-over-year for the first half of 2024. Earnings are forecasted to grow significantly at 33% annually, surpassing market averages, although high non-cash earnings warrant caution in assessing quality.
- Our earnings growth report unveils the potential for significant increases in Laopu Gold's future results.
- Get an in-depth perspective on Laopu Gold's balance sheet by reading our health report here.
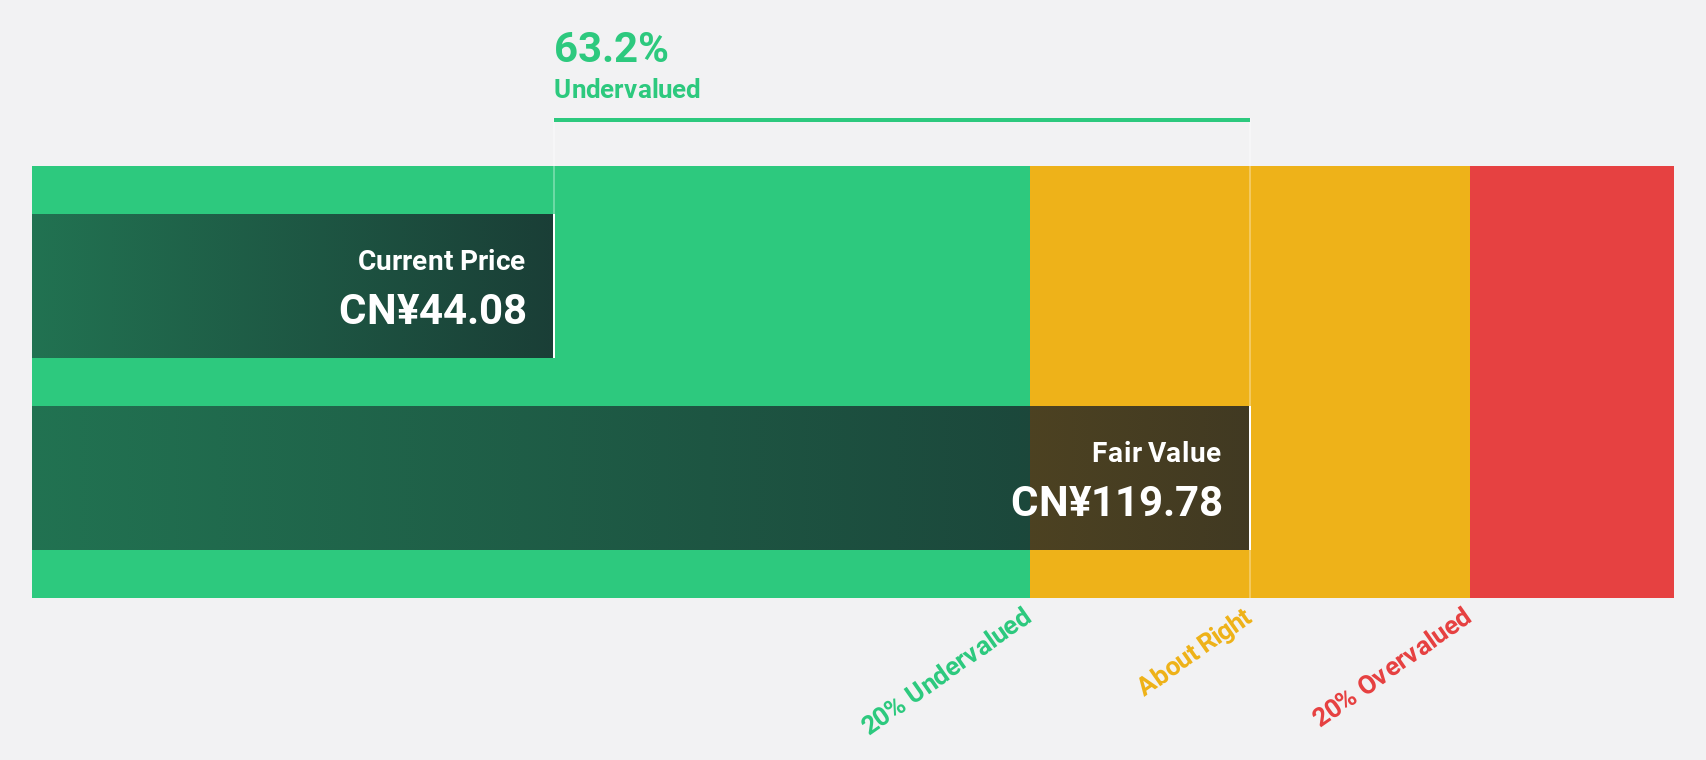
EVE Energy (SZSE:300014)
Overview: EVE Energy Co., Ltd. is a company that provides lithium batteries both in China and internationally, with a market capitalization of approximately CN¥98.08 billion.
Operations: The company's revenue from electronic component manufacturing amounts to CN¥47.30 billion.
Estimated Discount To Fair Value: 17.8%
EVE Energy is trading at CN¥48.06, below the estimated fair value of CN¥58.47, indicating potential undervaluation based on cash flows. Despite a recent decline in net income to CNY 3.19 billion for the nine months ended September 2024, earnings are expected to grow significantly by 27.7% annually over the next three years, outpacing market averages. However, high share price volatility and a dividend not well covered by free cash flows suggest caution is warranted.
- Our growth report here indicates EVE Energy may be poised for an improving outlook.
- Dive into the specifics of EVE Energy here with our thorough financial health report.
Taking Advantage
- Navigate through the entire inventory of 951 Undervalued Stocks Based On Cash Flows here.
- Already own these companies? Bring clarity to your investment decisions by linking up your portfolio with Simply Wall St, where you can monitor all the vital signs of your stocks effortlessly.
- Streamline your investment strategy with Simply Wall St's app for free and benefit from extensive research on stocks across all corners of the world.
Interested In Other Possibilities?
- Explore high-performing small cap companies that haven't yet garnered significant analyst attention.
- Diversify your portfolio with solid dividend payers offering reliable income streams to weather potential market turbulence.
- Fuel your portfolio with companies showing strong growth potential, backed by optimistic outlooks both from analysts and management.
This article by Simply Wall St is general in nature. We provide commentary based on historical data and analyst forecasts only using an unbiased methodology and our articles are not intended to be financial advice. It does not constitute a recommendation to buy or sell any stock, and does not take account of your objectives, or your financial situation. We aim to bring you long-term focused analysis driven by fundamental data. Note that our analysis may not factor in the latest price-sensitive company announcements or qualitative material. Simply Wall St has no position in any stocks mentioned.
New: AI Stock Screener & Alerts
Our new AI Stock Screener scans the market every day to uncover opportunities.
• Dividend Powerhouses (3%+ Yield)• Undervalued Small Caps with Insider Buying• High growth Tech and AI CompaniesOr build your own from over 50 metrics.
Explore Now for FreeHave feedback on this article? Concerned about the content? Get in touch with us directly. Alternatively, email editorial-team@simplywallst.com
免责声明:投资有风险,本文并非投资建议,以上内容不应被视为任何金融产品的购买或出售要约、建议或邀请,作者或其他用户的任何相关讨论、评论或帖子也不应被视为此类内容。本文仅供一般参考,不考虑您的个人投资目标、财务状况或需求。TTM对信息的准确性和完整性不承担任何责任或保证,投资者应自行研究并在投资前寻求专业建议。
热议股票
- 1
- 2
- 3
- 4
- 5
- 6
- 7
- 8
- 9
- 10