Market Trends Lift Aptos (APT) Price Up, Yet Decline Might Follow
- APT spikes 2% but remains vulnerable; broader market lift may soon reverse.
- Price analysis shows APT below key 20-day and 50-day moving averages.
- Bearish indicators suggest APT may fall toward $5.57 unless support holds.
APT, the native token of Layer-1 blockchain Aptos, has risen by 2% over the past 24 hours. However, a review of the one-day chart suggests that the Aptos price rally merely mirrors the uptick in the broader cryptocurrency market during that period.
Despite the recent uptick, APT faces a strong bearish bias, which could erase these gains soon. This analysis explores the factors contributing to the persistent bearish outlook for APT.
Aptos Climbs, But There Is a Catch
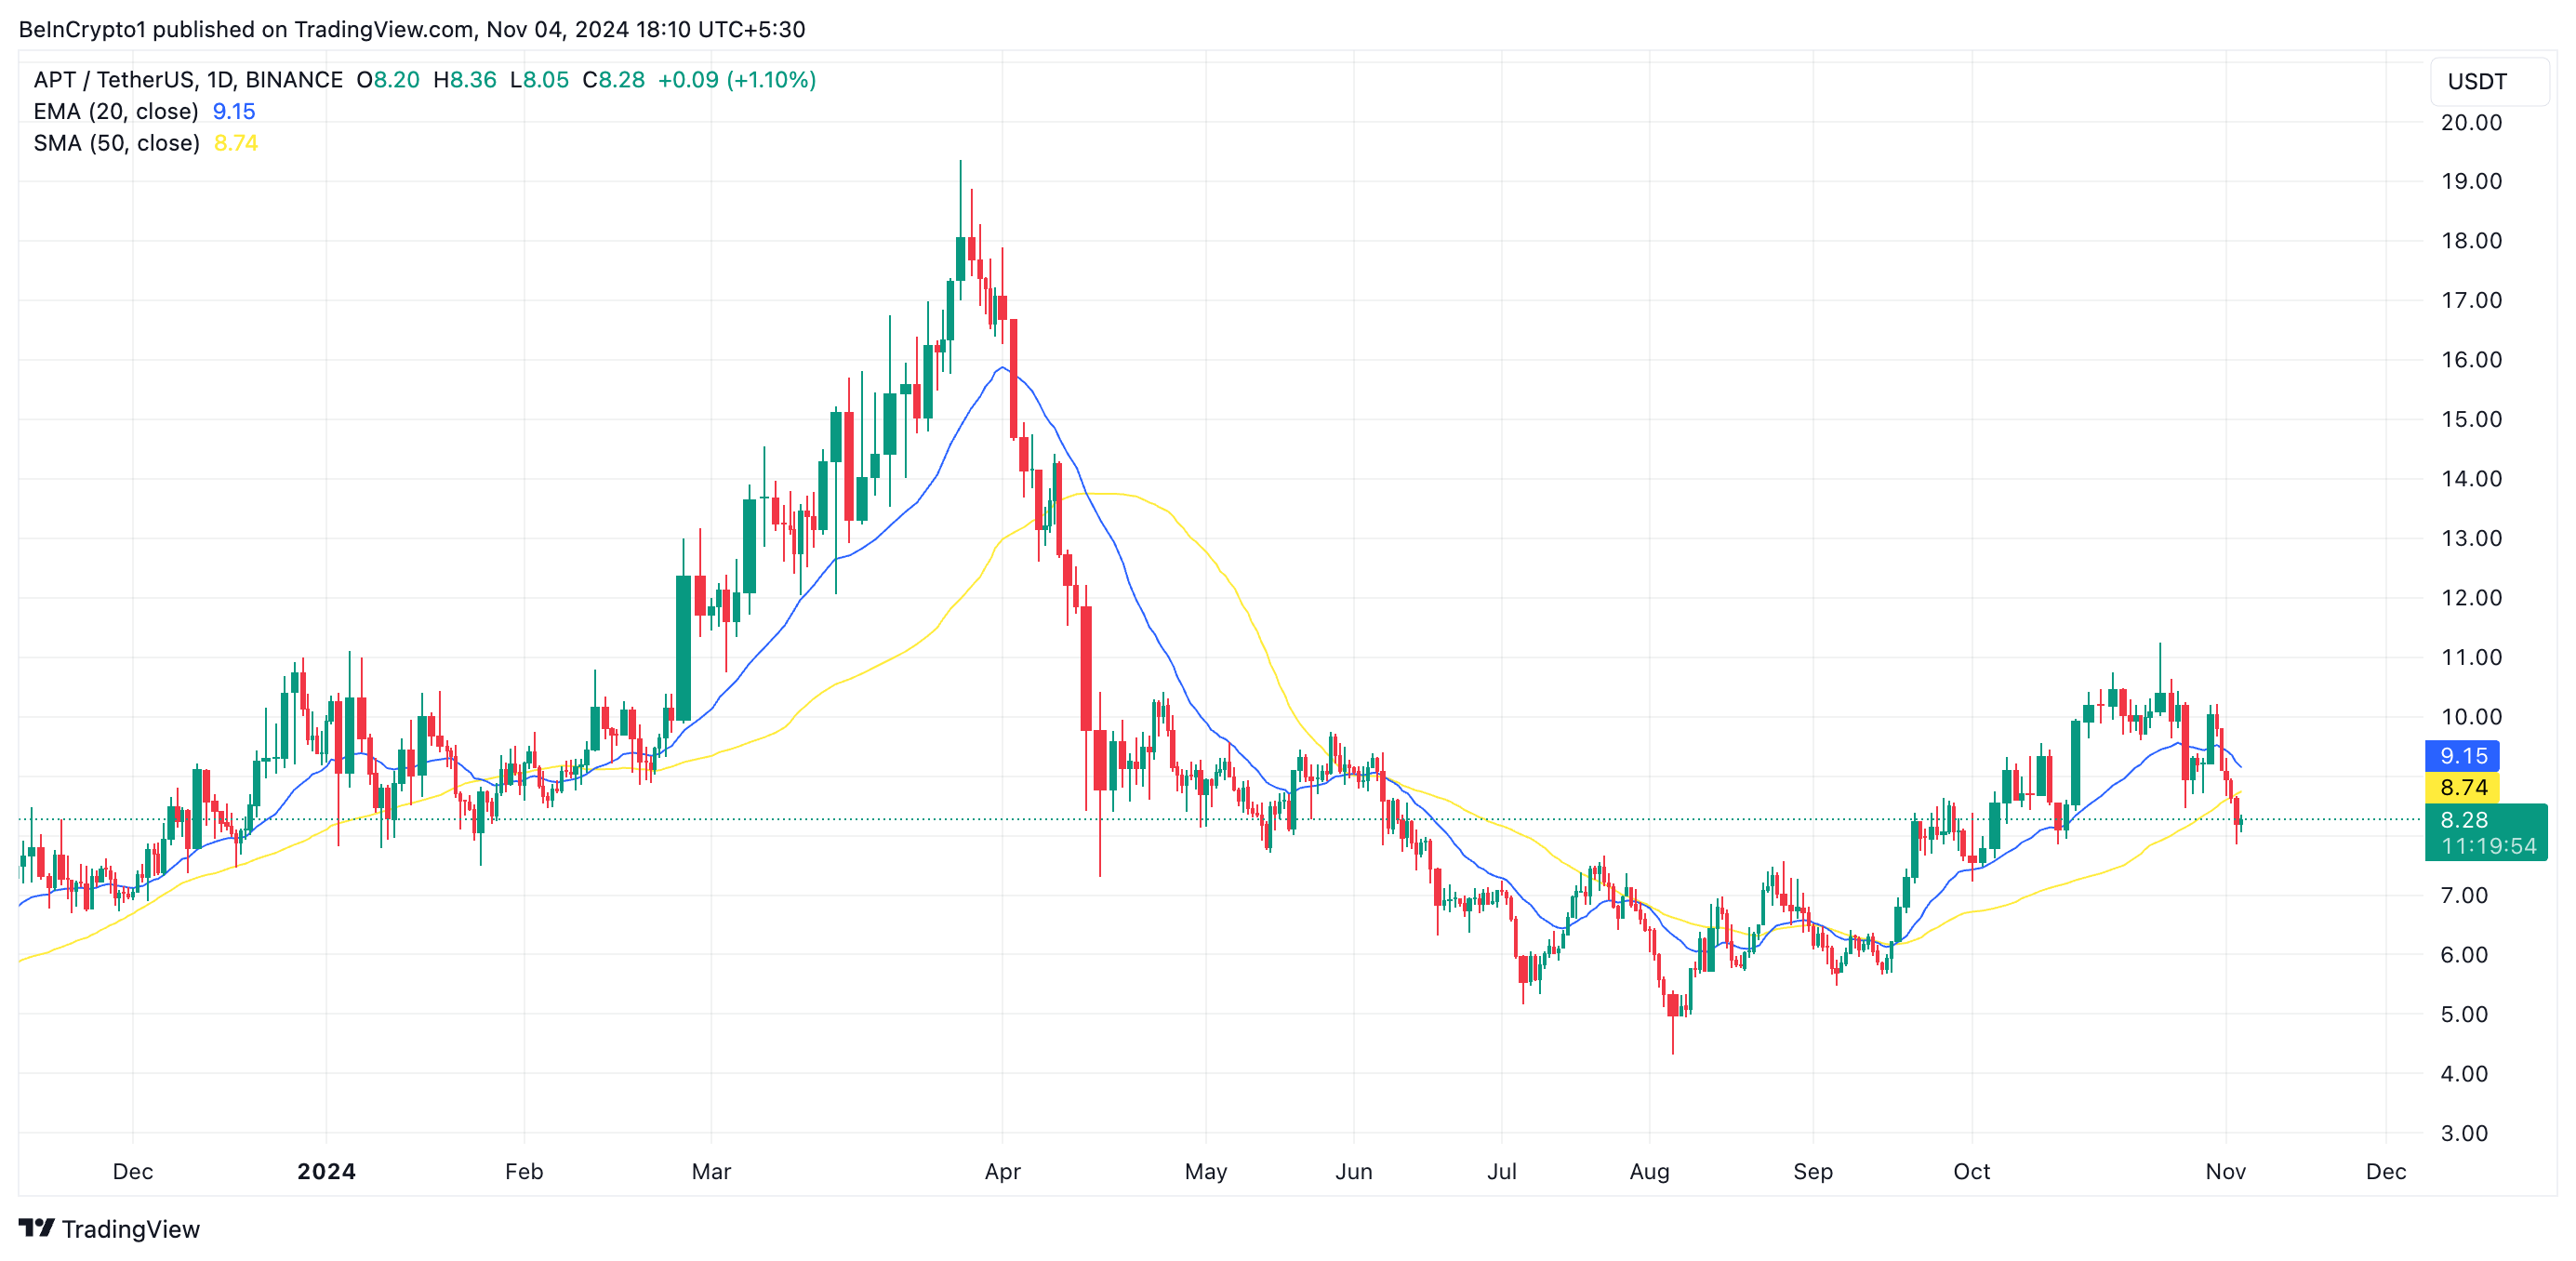
Over the past week, APT’s price has dropped by 8%. This decline has pushed the coin’s value below its 20-day exponential moving average (EMA) and 50-day small moving average (SMA). The 20-day EMA measures an asset’s average price over the past 20 trading days, while its 50-day SMA tracks its price over the past 50 trading days.
When an asset’s price dips below key moving averages, it indicates a negative momentum shift. A drop below the 20-day EMA suggests a short-term bearish trend, pointing to weakening recent price action. In contrast, falling below the 50-day SMA is a stronger signal of a potential longer-term trend reversal, implying that upward momentum may be fading.
Read more: Aptos Crypto (APT): A Guide to What it Is and How it Works
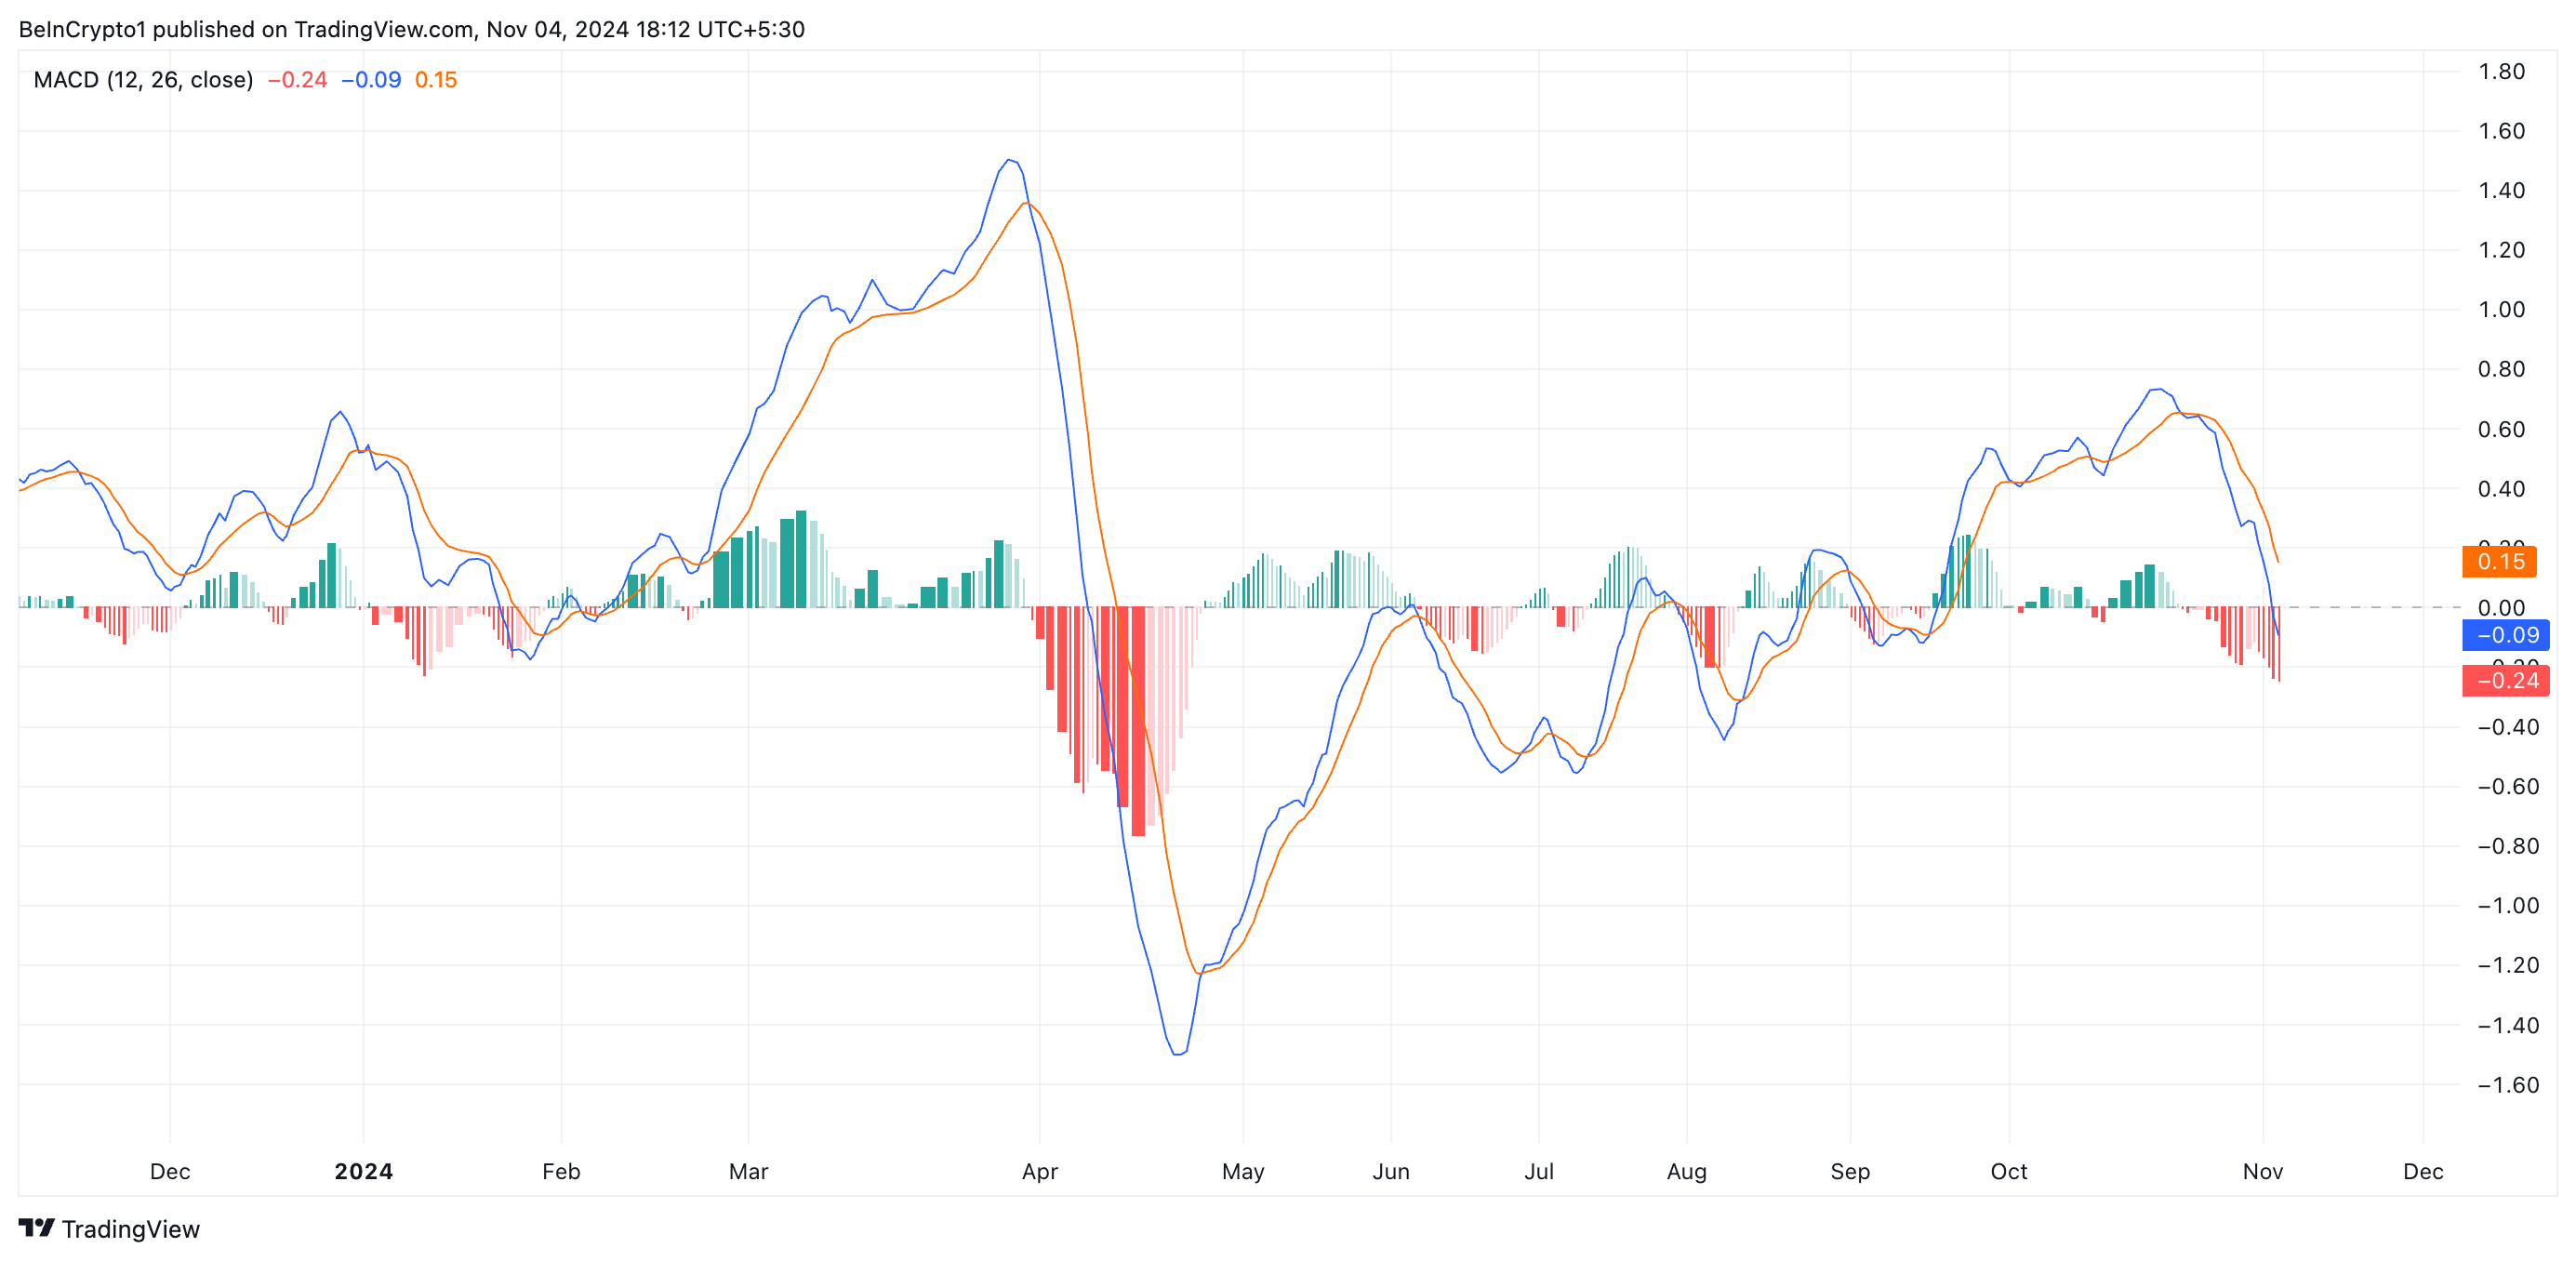
The setup of APT’s moving average convergence/divergence (MACD) reinforces the bearish outlook. Currently, the MACD line (blue) is positioned below both the signal line (orange) and the zero line.
As an indicator of price trends and momentum, the MACD helps identify potential buy or sell signals. This alignment indicates a strong bearish trend, suggesting that overall momentum is negative and confirming that APT is in a downtrend.
APT Price Prediction: Charting the Path to $10.07
At press time, APT is trading at $8.27, holding just above a support level at $7.87. If buying pressure weakens, the price may test this support, and failure to hold could see APT plunge further to $5.66, where it might seek to establish a new support base.
Read more: Where To Buy Aptos (APT): 5 Best Platforms for 2024
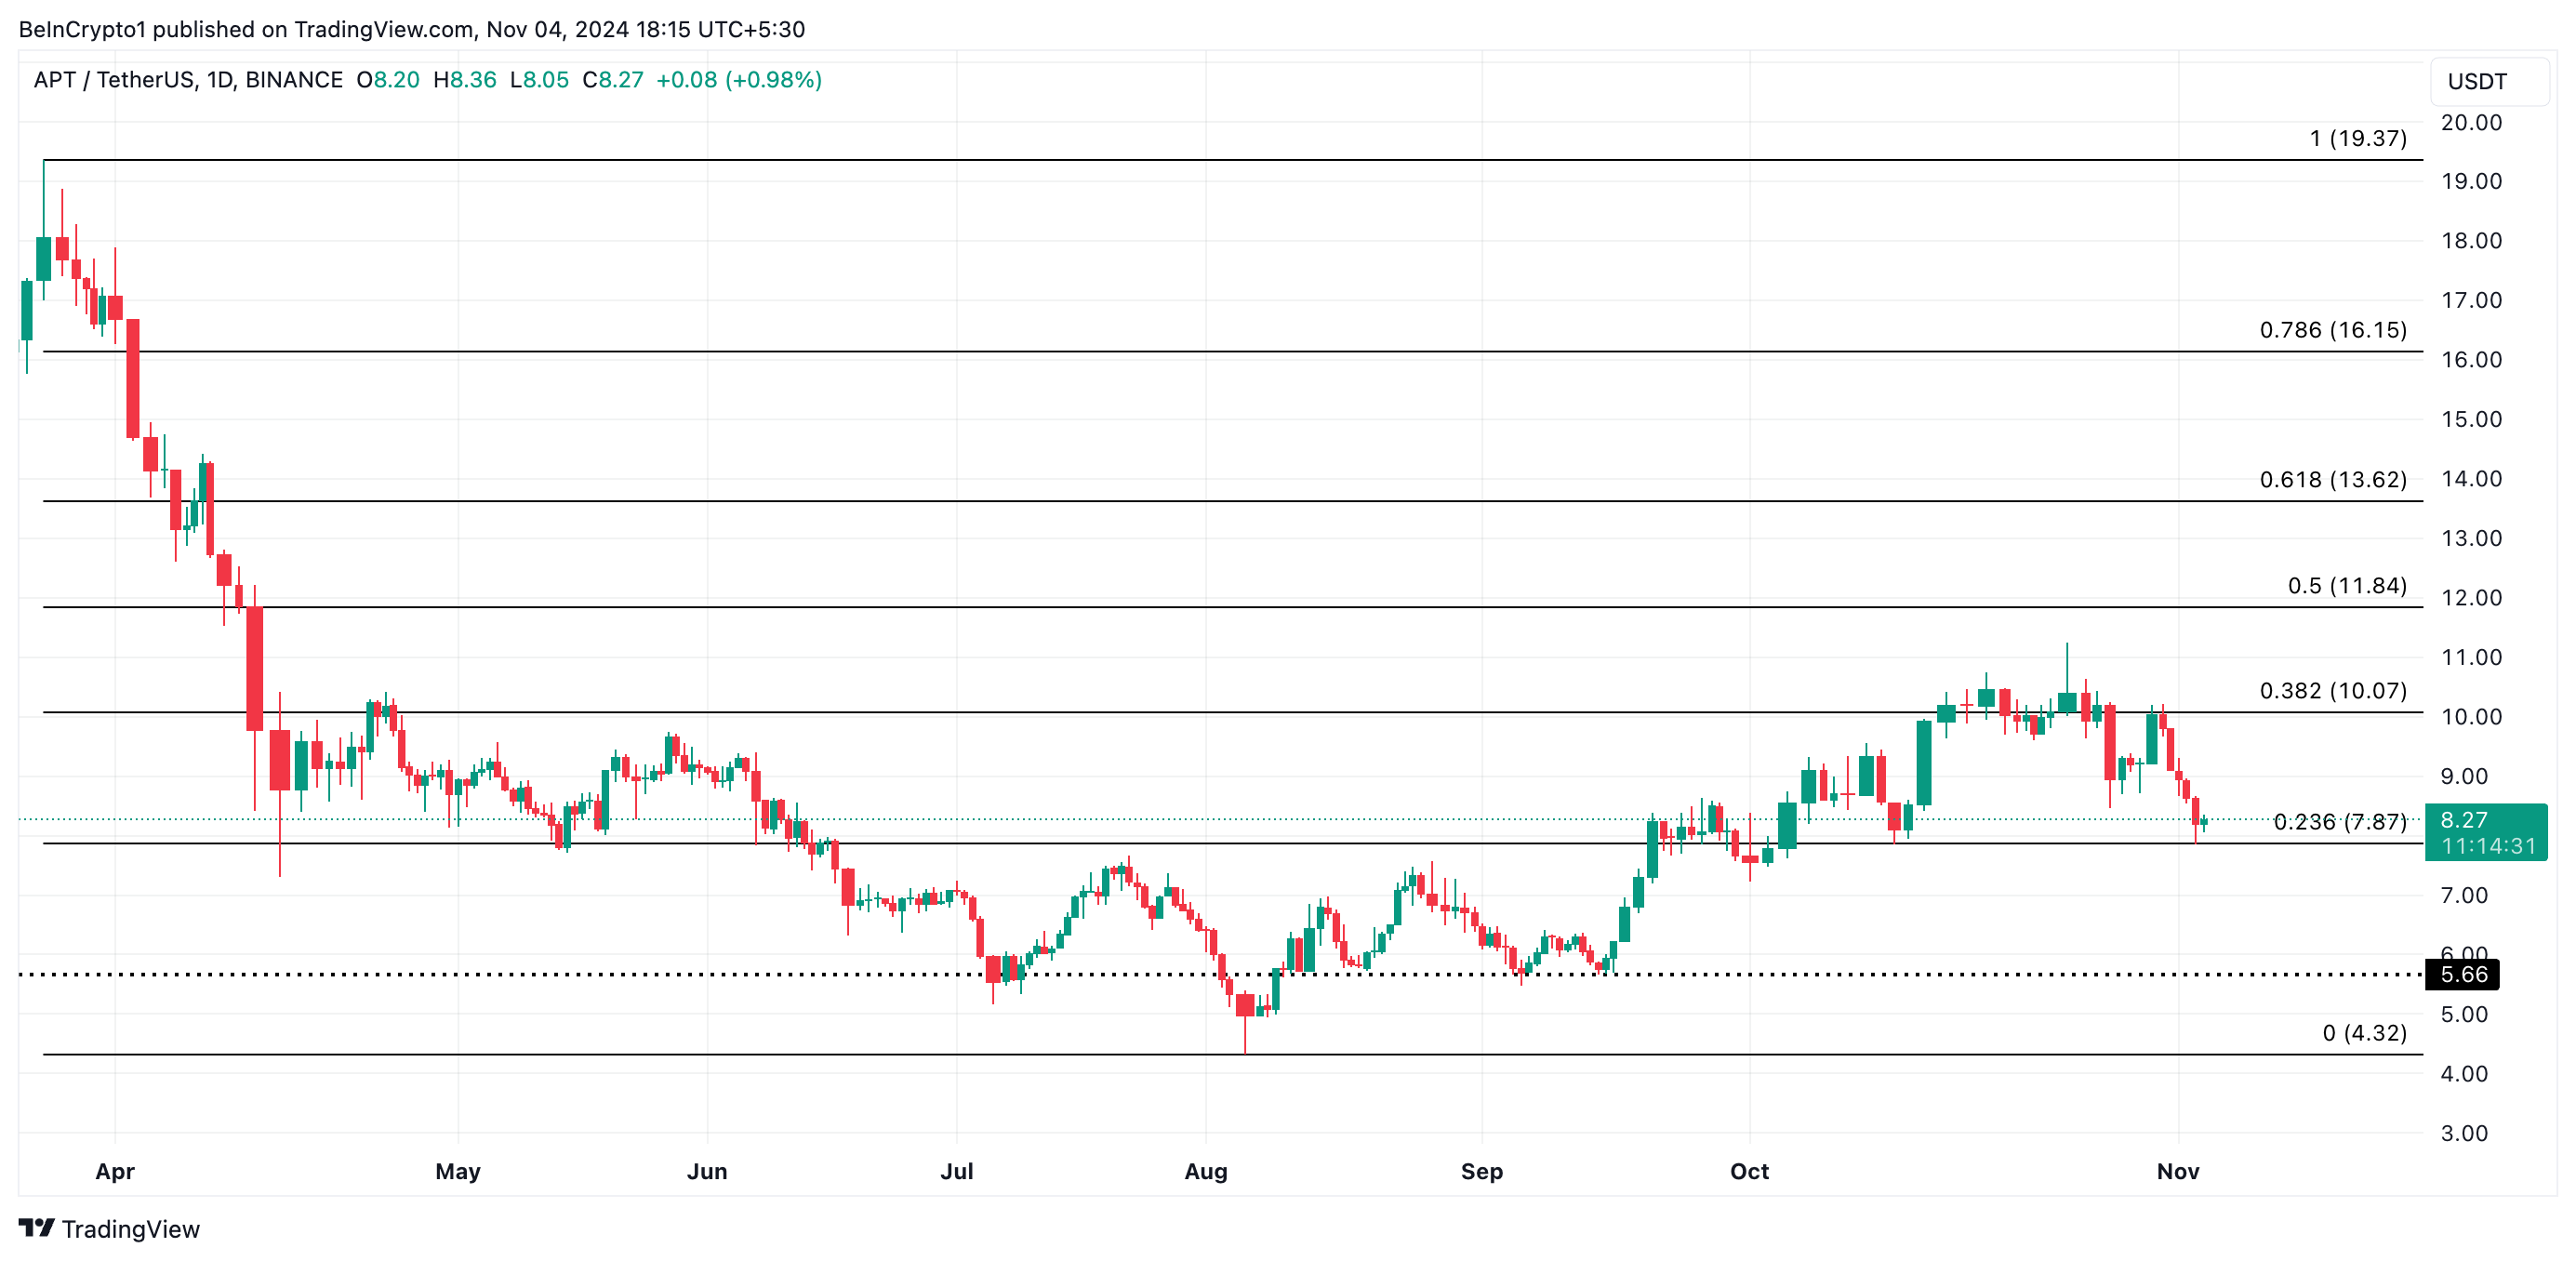
This bearish outlook would be invalidated if APT’s price rally gains strength, driven by renewed demand. In this case, APT would likely bounce off the $7.87 support and aim to climb above the $10.07 level.
免责声明:投资有风险,本文并非投资建议,以上内容不应被视为任何金融产品的购买或出售要约、建议或邀请,作者或其他用户的任何相关讨论、评论或帖子也不应被视为此类内容。本文仅供一般参考,不考虑您的个人投资目标、财务状况或需求。TTM对信息的准确性和完整性不承担任何责任或保证,投资者应自行研究并在投资前寻求专业建议。
热议股票
- 1
- 2
- 3
- 4
- 5
- 6
- 7
- 8
- 9
- 10