Here Is What Aptos (APT) Needs To Rise Back To $17
- Aptos surges 47% in a week: Bullish EMA lines and Ichimoku signals show strong momentum, but RSI pullback indicates moderation.
- RSI signals balance: APT's RSI dropped to 62 from over 80, signaling eased buying pressure and a sustainable uptrend.
- Potential 44% price gain: EMA setup suggests further gains, with $14.42 resistance in sight and $17.89 possible if bullish momentum holds.
Aptos (APT) price has been experiencing a strong rally, surging 47% in the past seven days. The recent momentum has been supported by positive indicators, such as bullish EMA lines and favorable Ichimoku signals, which point to continued buying interest.
However, while APT remains in an upward trend, the recent pullback in RSI suggests that the asset may be moving towards a more balanced state.
APT Is In The Neutral Stage
APT’s RSI is currently at 62, down from over 80 just a day ago. This decline indicates that the recent intense buying pressure has eased, allowing APT to move out of the overbought zone.
While bullish momentum still persists, the drop suggests that the buying intensity has cooled off, reducing the immediate risk of a sharp correction.
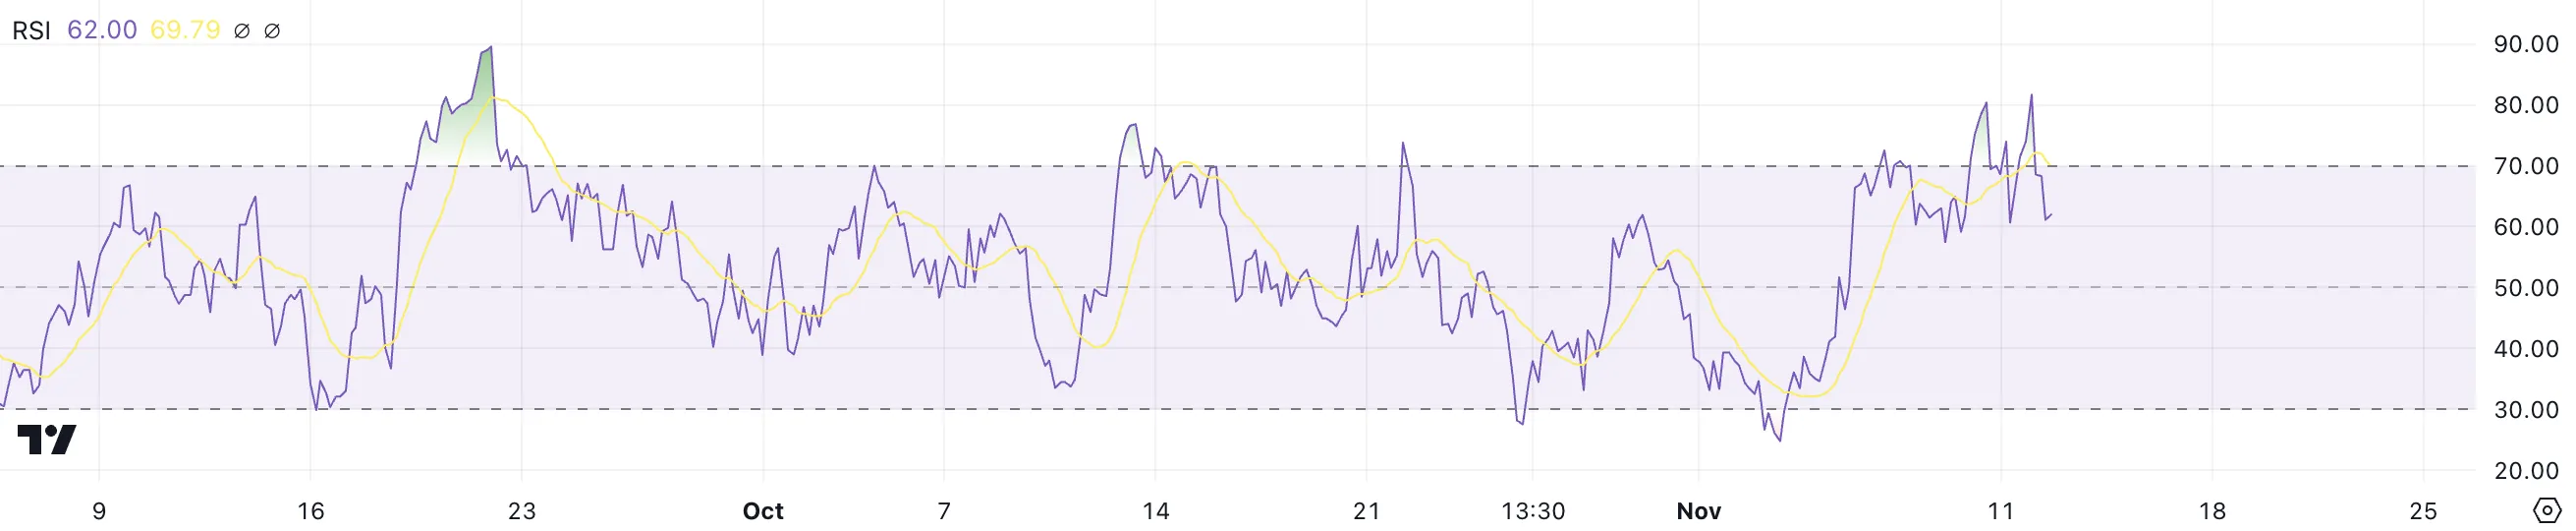
The RSI is a momentum indicator that ranges from 0 to 100. It is used to gauge whether an asset is overbought or oversold. Typically, values above 70 signal overbought conditions, while below 30 suggest oversold levels.
With APT’s RSI now at 62, following a 47.13% increase in its price the last week, it shows that the asset maintains positive momentum without being overextended. This could indicate a more sustainable uptrend as buying enthusiasm moderates.
Aptos Ichimoku Cloud Shows a Bullish Setup
The Ichimoku Cloud chart for Aptos (APT) shows a strong bullish trend, with the price clearly above the cloud. This indicates that APT is in a favorable upward momentum, supported by positive market sentiment.
The Tenkan-sen (blue line) is positioned above the Kijun-sen (red line), which confirms that short-term momentum is strong and driving the price higher.
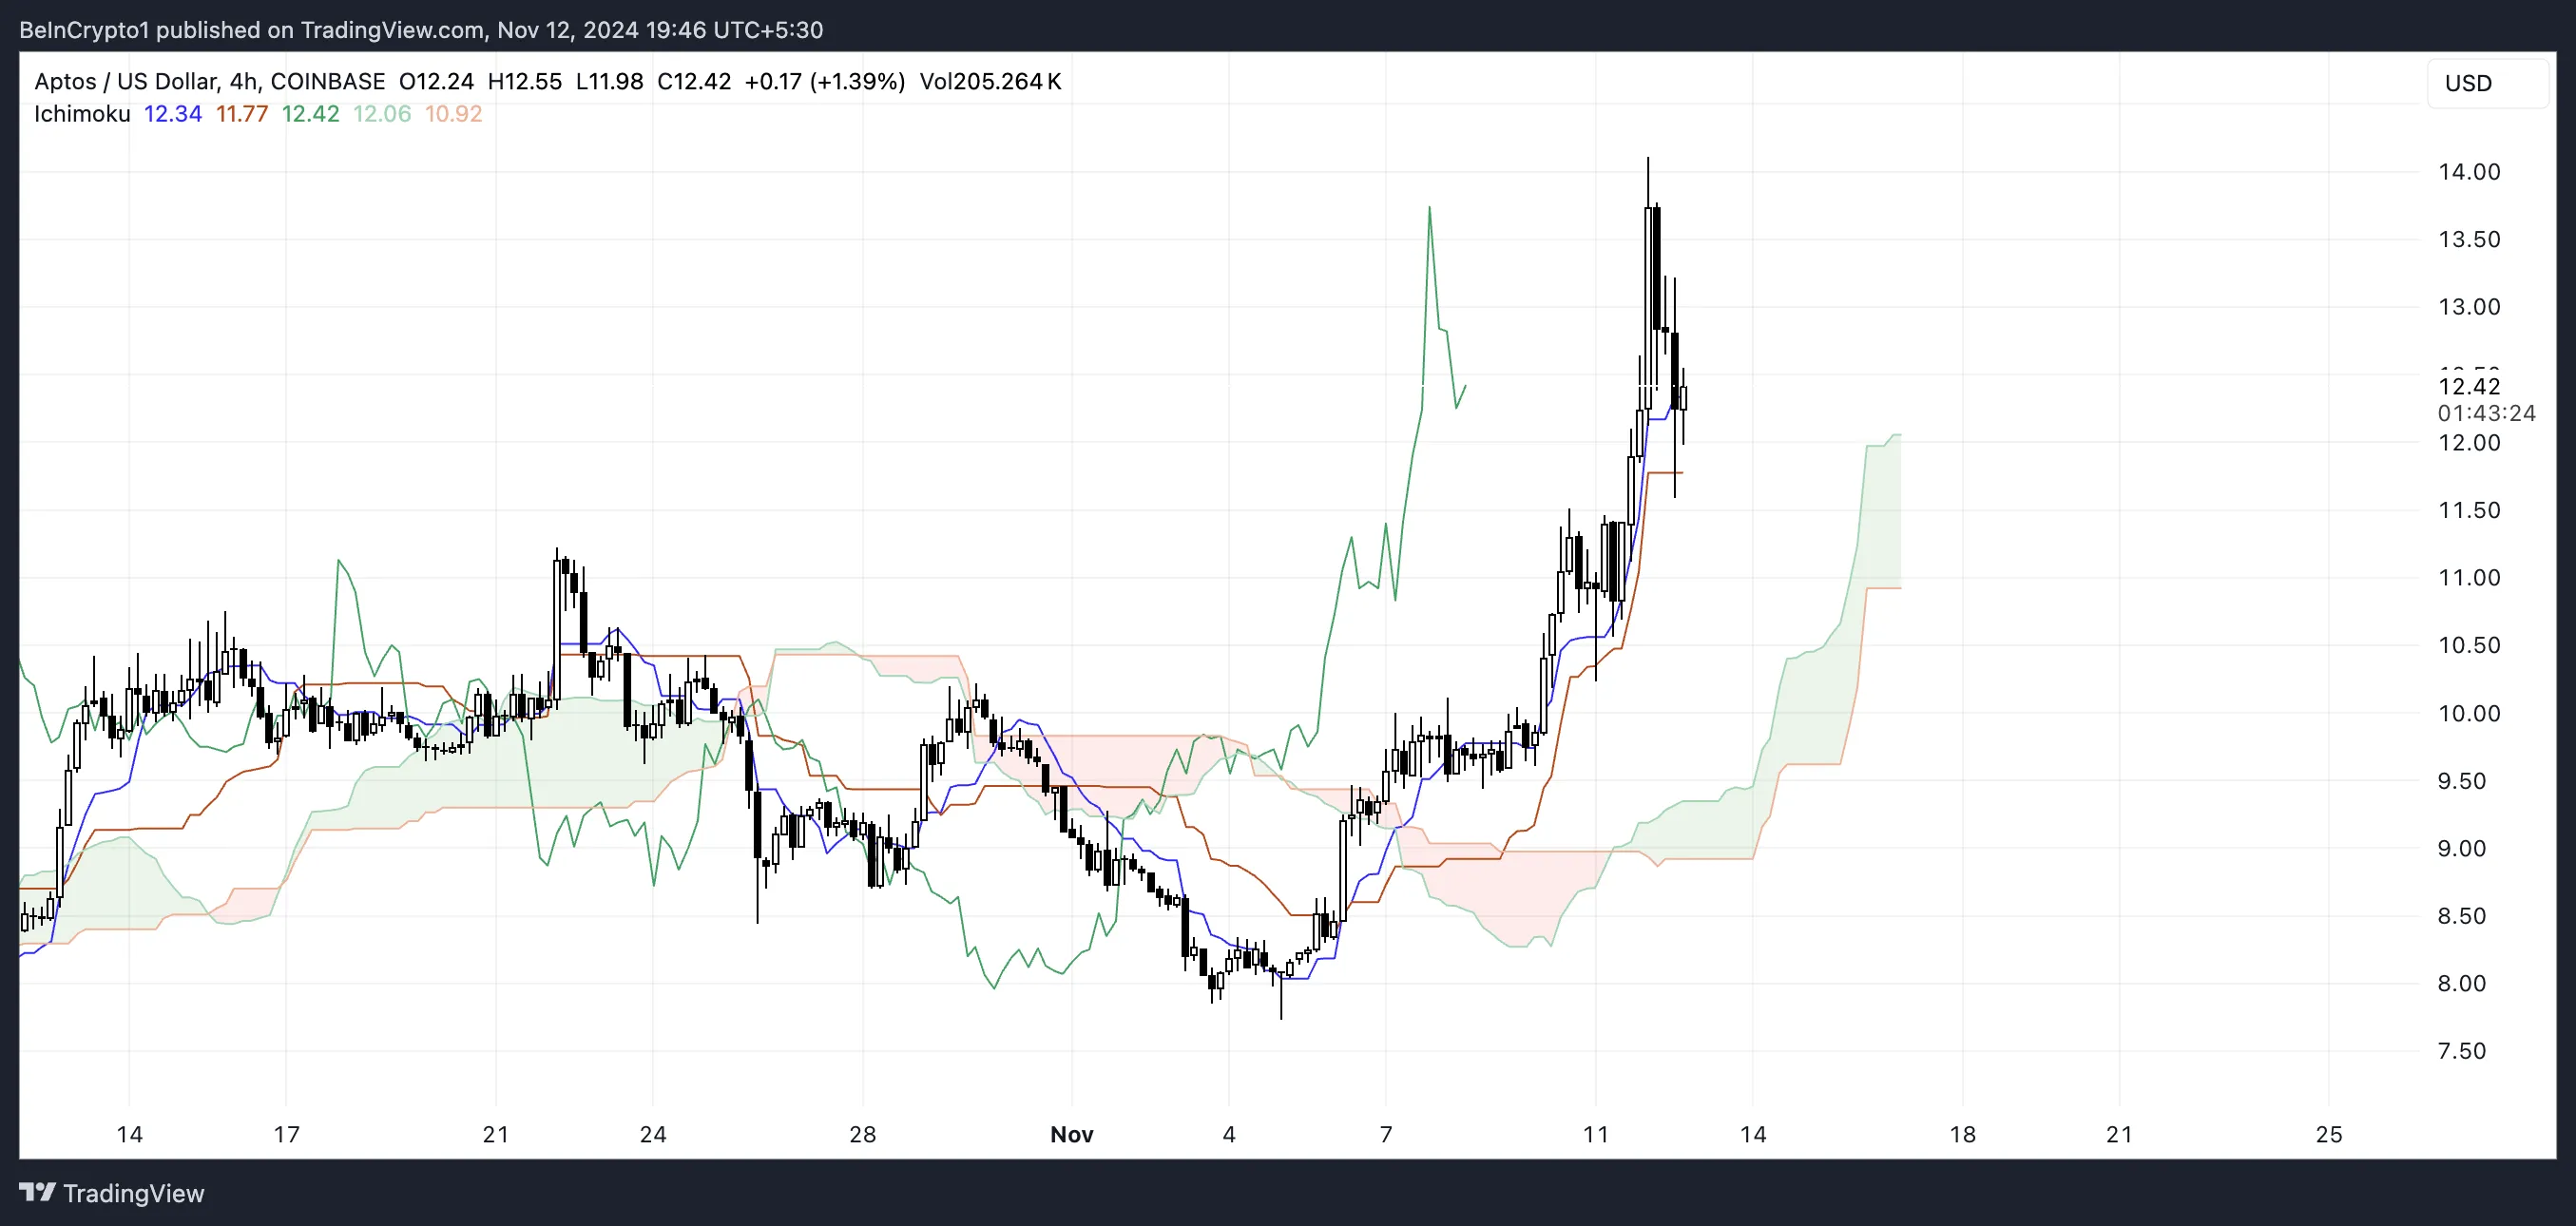
Additionally, the cloud itself (formed by the leading span lines) is green and expanding, suggesting a continuation of the uptrend.
The overall alignment of the Ichimoku components points to a healthy bullish trend, with buyers currently in control and price action maintaining a positive trajectory.
APT Price Prediction: A Potential 44% Rise?
APT’s EMA lines indicate a strong bullish setting, with the short-term lines positioned above the long-term lines. This alignment shows that buying momentum is dominant and that APT price is likely to continue trending upwards.
The current EMA structure supports the idea that buyers are in control and that the uptrend may persist as long as these conditions hold.
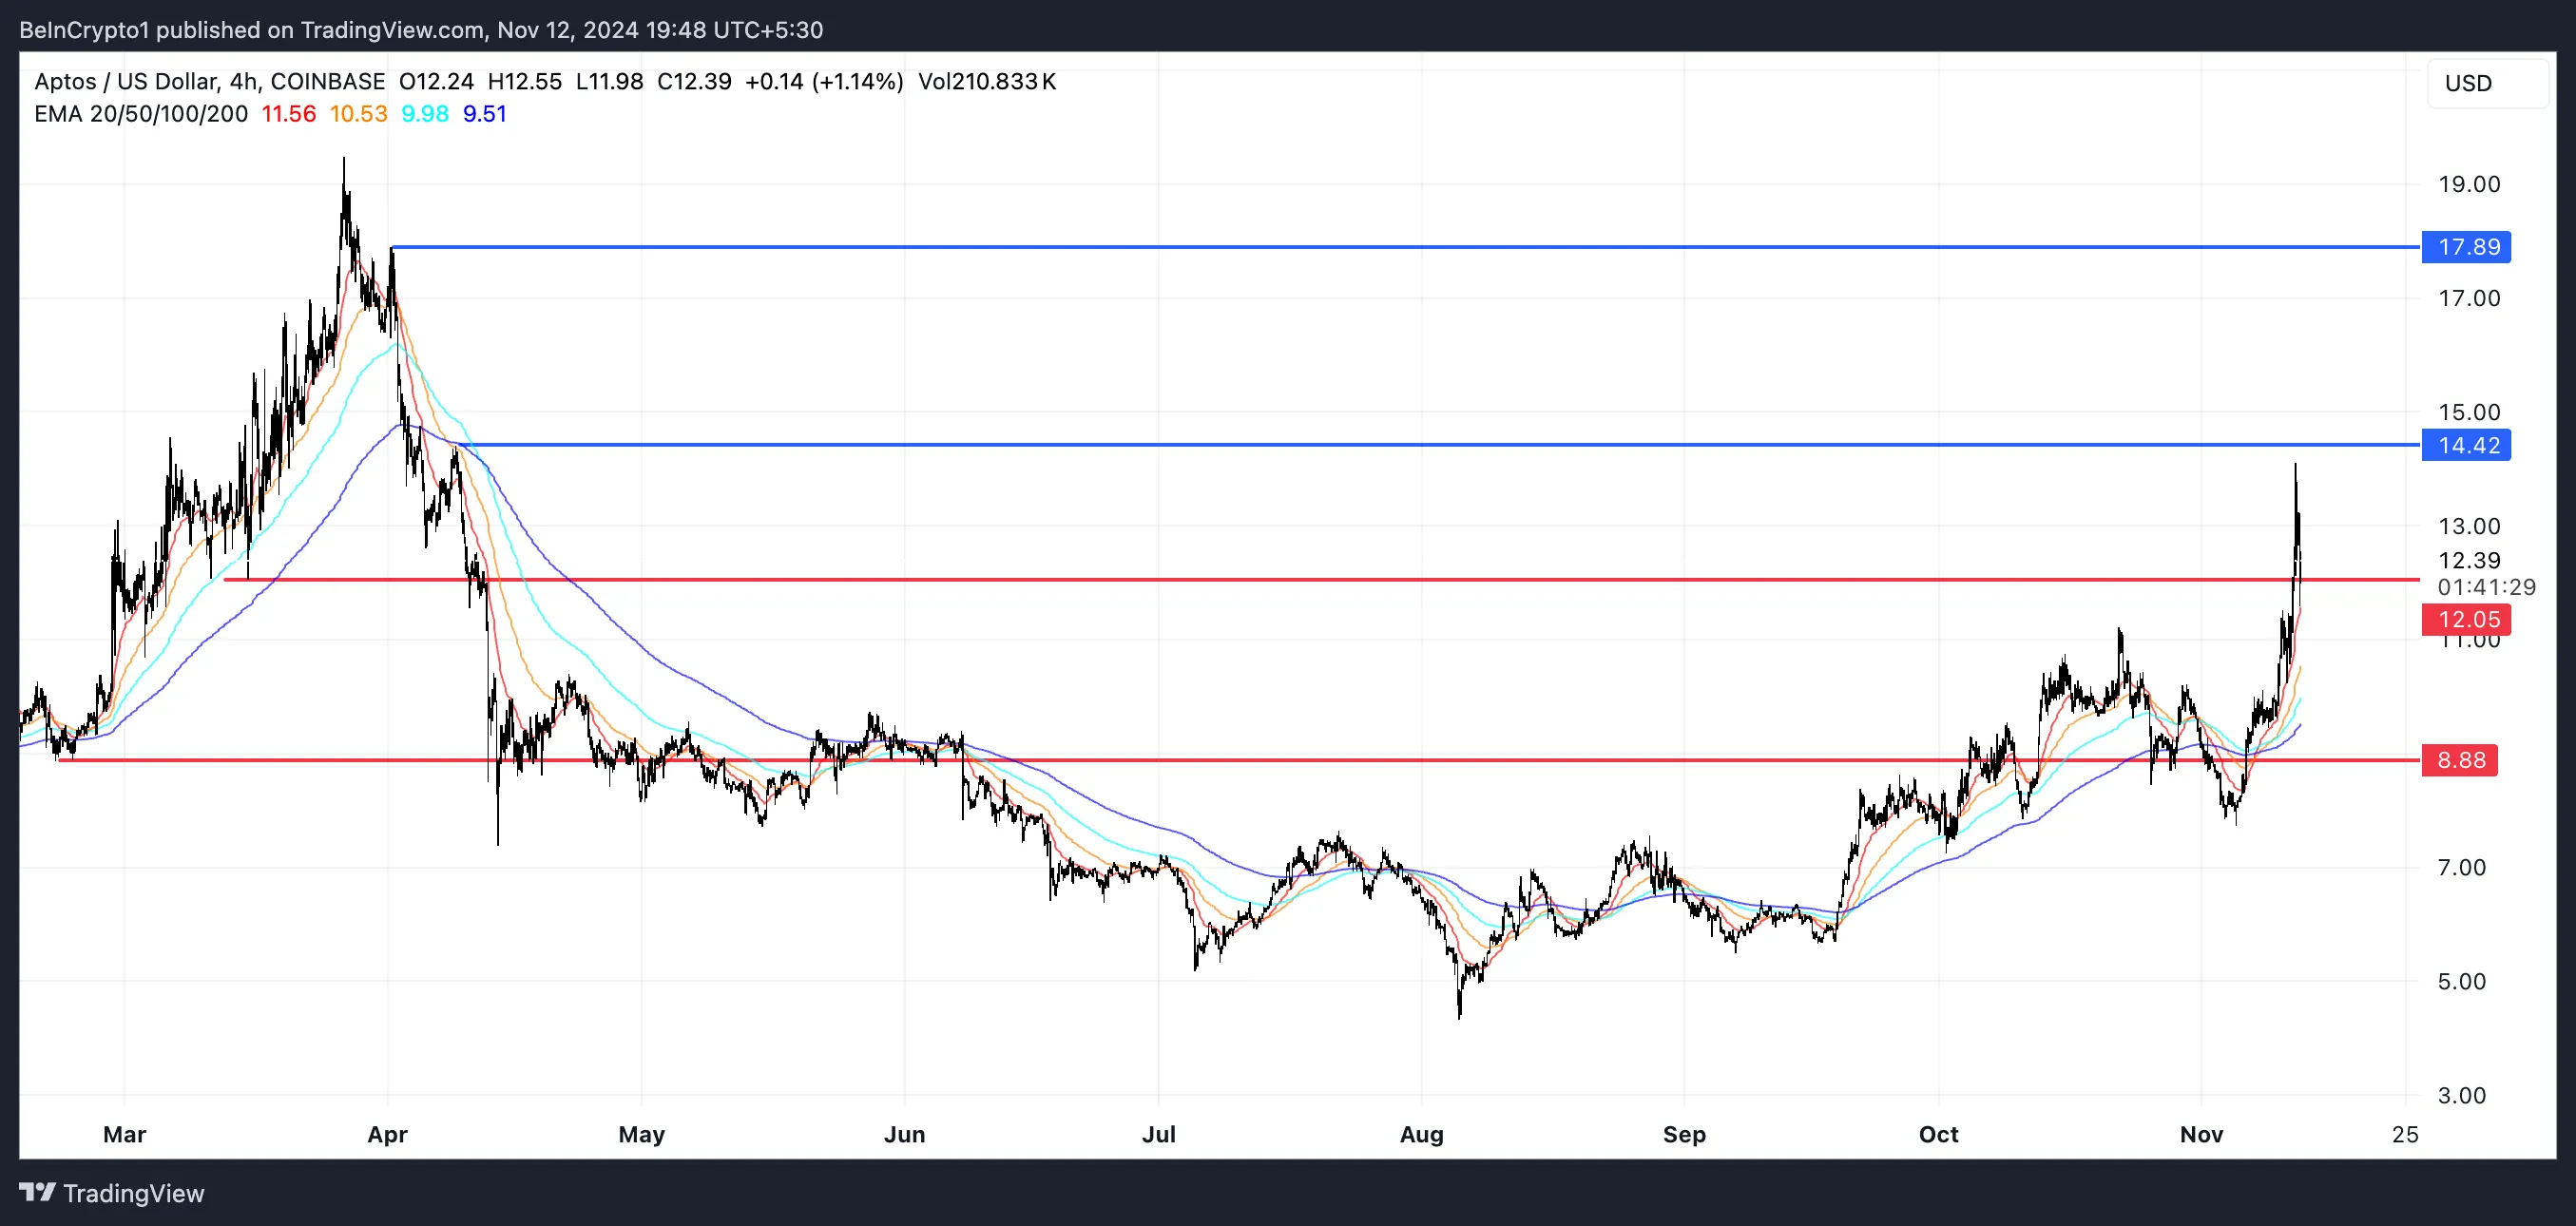
If this bullish momentum continues, APT could soon test the next significant resistance level at $14.42. A successful break above that could push the price even higher, potentially reaching $17.89, marking a 44% rise and the highest level since April.
However, if the RSI surpasses 70, signaling overbought conditions, a downtrend could form. In that scenario, APT price might first test the support at $12.05, and if that level fails, the price could fall further to $8.88.
免责声明:投资有风险,本文并非投资建议,以上内容不应被视为任何金融产品的购买或出售要约、建议或邀请,作者或其他用户的任何相关讨论、评论或帖子也不应被视为此类内容。本文仅供一般参考,不考虑您的个人投资目标、财务状况或需求。TTM对信息的准确性和完整性不承担任何责任或保证,投资者应自行研究并在投资前寻求专业建议。
热议股票
- 1
- 2
- 3
- 4
- 5
- 6
- 7
- 8
- 9
- 10