Mantra (OM) Price Hits All-Time Highs Amid Strong Uptrend
- OM price surges 20%, hits new highs: Robust technical indicators like ADX (26.48) and Ichimoku Cloud confirm a bullish trend.
- EMA alignment backs sustained uptrend: OM price stays above key EMAs, reinforcing upward momentum and dynamic support.
- Potential for new highs, but key support zones critical: A reversal could test $1.35 or lower, with $1.25 as a critical support level.
Mantra (OM) price has been on a strong upward trajectory, recently reaching a new all-time high and gaining nearly 20% over the past week. This surge has been supported by strengthening technical indicators, showcasing strong momentum and a clear uptrend.
The combination of bullish EMA alignment and favorable metrics like ADX and Ichimoku Cloud suggests the rally may extend further, with the potential for new highs in the coming days. However, if the uptrend loses momentum, OM could test key support zones that will determine the sustainability of its recent gains.
OM’s Uptrend Is Getting Stronger
The ADX for OM has climbed from nearly 16 to 26.48 in just one day, highlighting a significant increase in trend strength.
An ADX above 25 typically signals a strong trend, and this surge indicates that OM is transitioning from a weak or sideways market to a clear and potentially sustained movement.
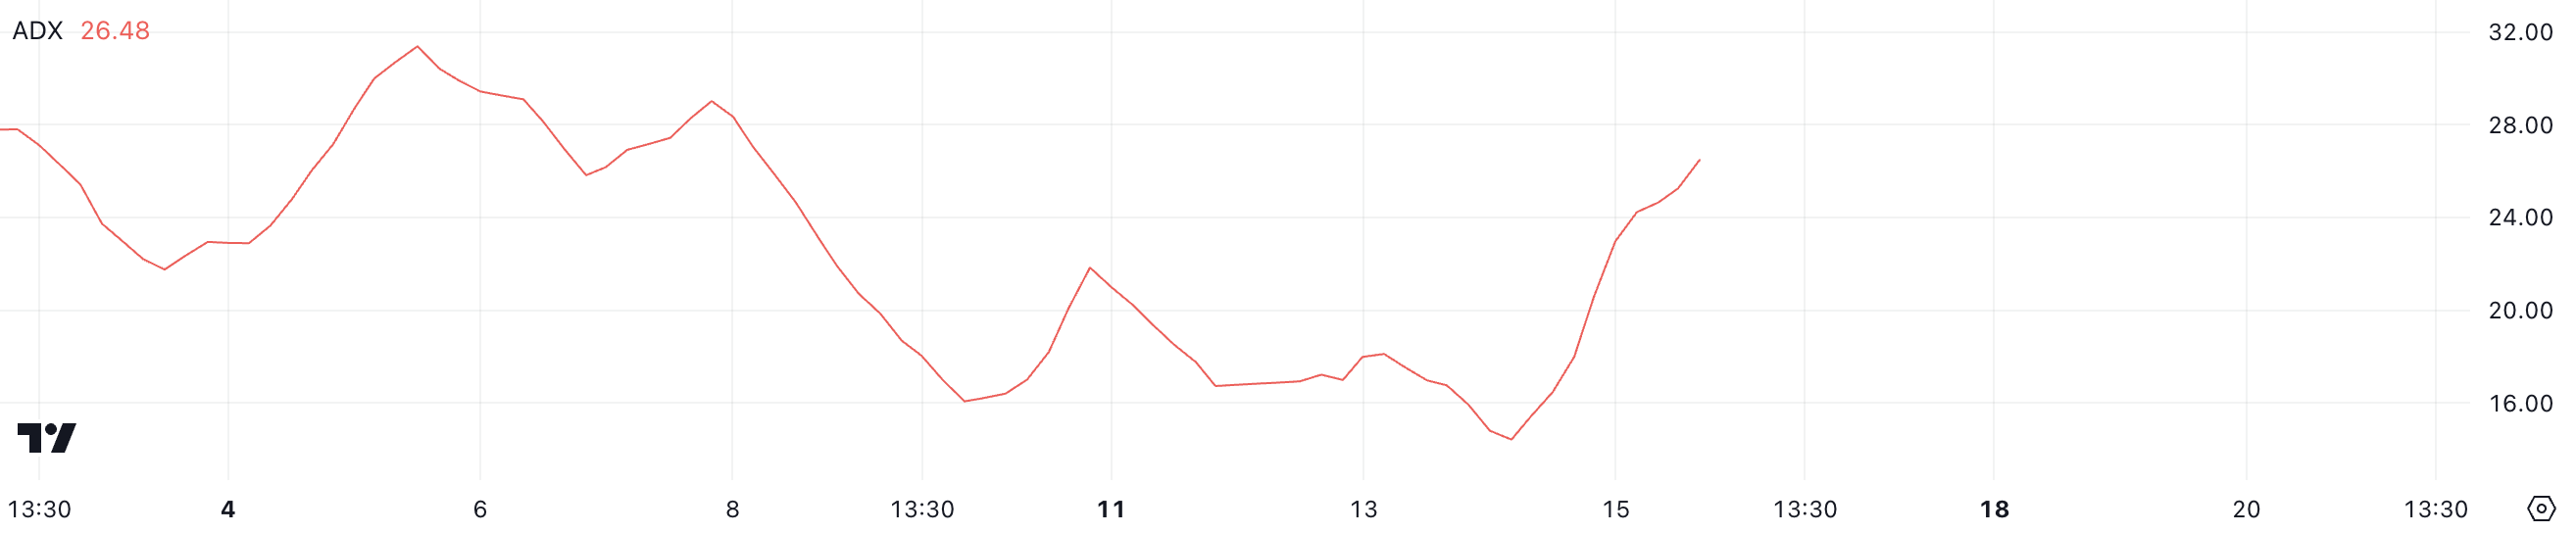
ADX, or Average Directional Index, measures trend strength on a scale from 0 to 100. Values below 20 show weak trends, while values above 25 signal strength.
With OM’s ADX at 26.48, the market is confirming an uptrend, supported by growing momentum and a stronger directional push, suggesting further gains could be on the horizon.
Ichimoku Cloud Shows OM Trend Is Bullish
The Ichimoku Cloud chart for OM price shows a bullish trend forming. The price has broken above the cloud (Kumo), which typically signals an uptrend.
Additionally, the cloud ahead (Senkou Span A and B) is green, indicating positive momentum and potential support levels. The price staying above the cloud further supports the likelihood of continued upward movement.
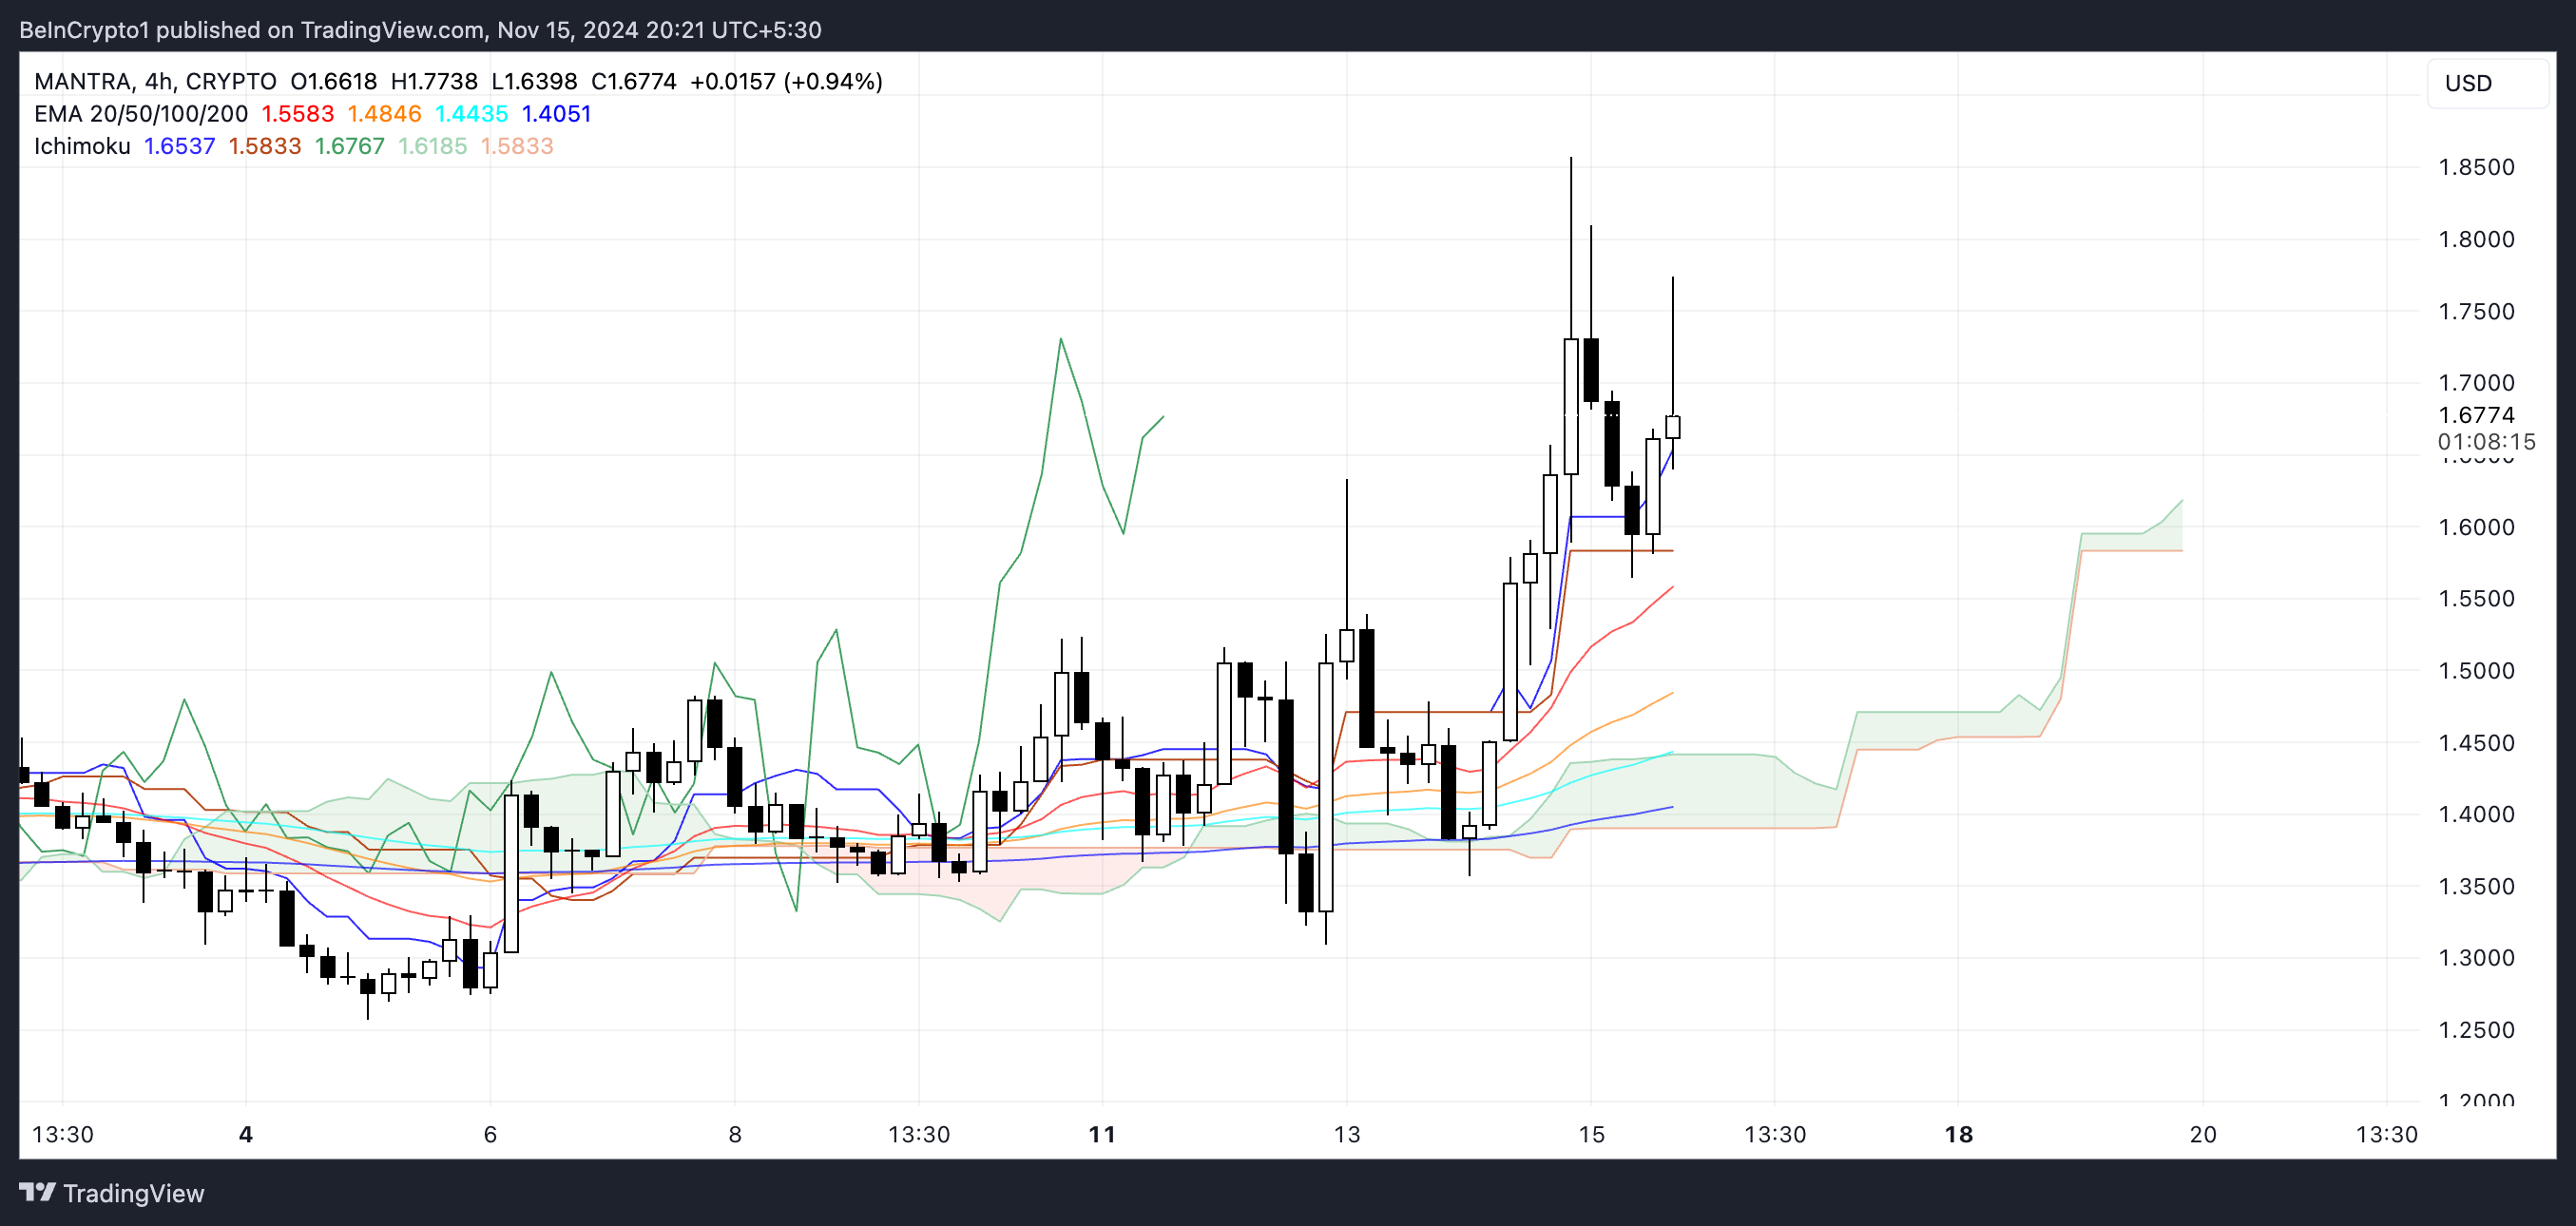
The Tenkan-sen (conversion line) is above the Kijun-sen (base line), another bullish signal suggesting that short-term momentum is stronger than the longer-term trend.
The lagging span (Chikou Span) is also positioned above the price, confirming that recent price action strongly supports the current trend. Together, these elements highlight a strengthening bullish sentiment for OM.
OM Price Prediction: New Highs Soon?
Mantra’s EMA lines currently exhibit a strong bullish alignment, with the price trading above all of them and shorter-term EMAs positioned above the longer-term ones. OM is one of the leading coins in the real-world assets ecosystem today and could benefit heavily if this narrative keeps growing.
This structure reflects solid upward momentum, reinforcing the notion of a sustained uptrend. The recent price action supports this bullish outlook, as OM price has managed to maintain levels well above key EMA thresholds, which often serve as dynamic support during uptrends.
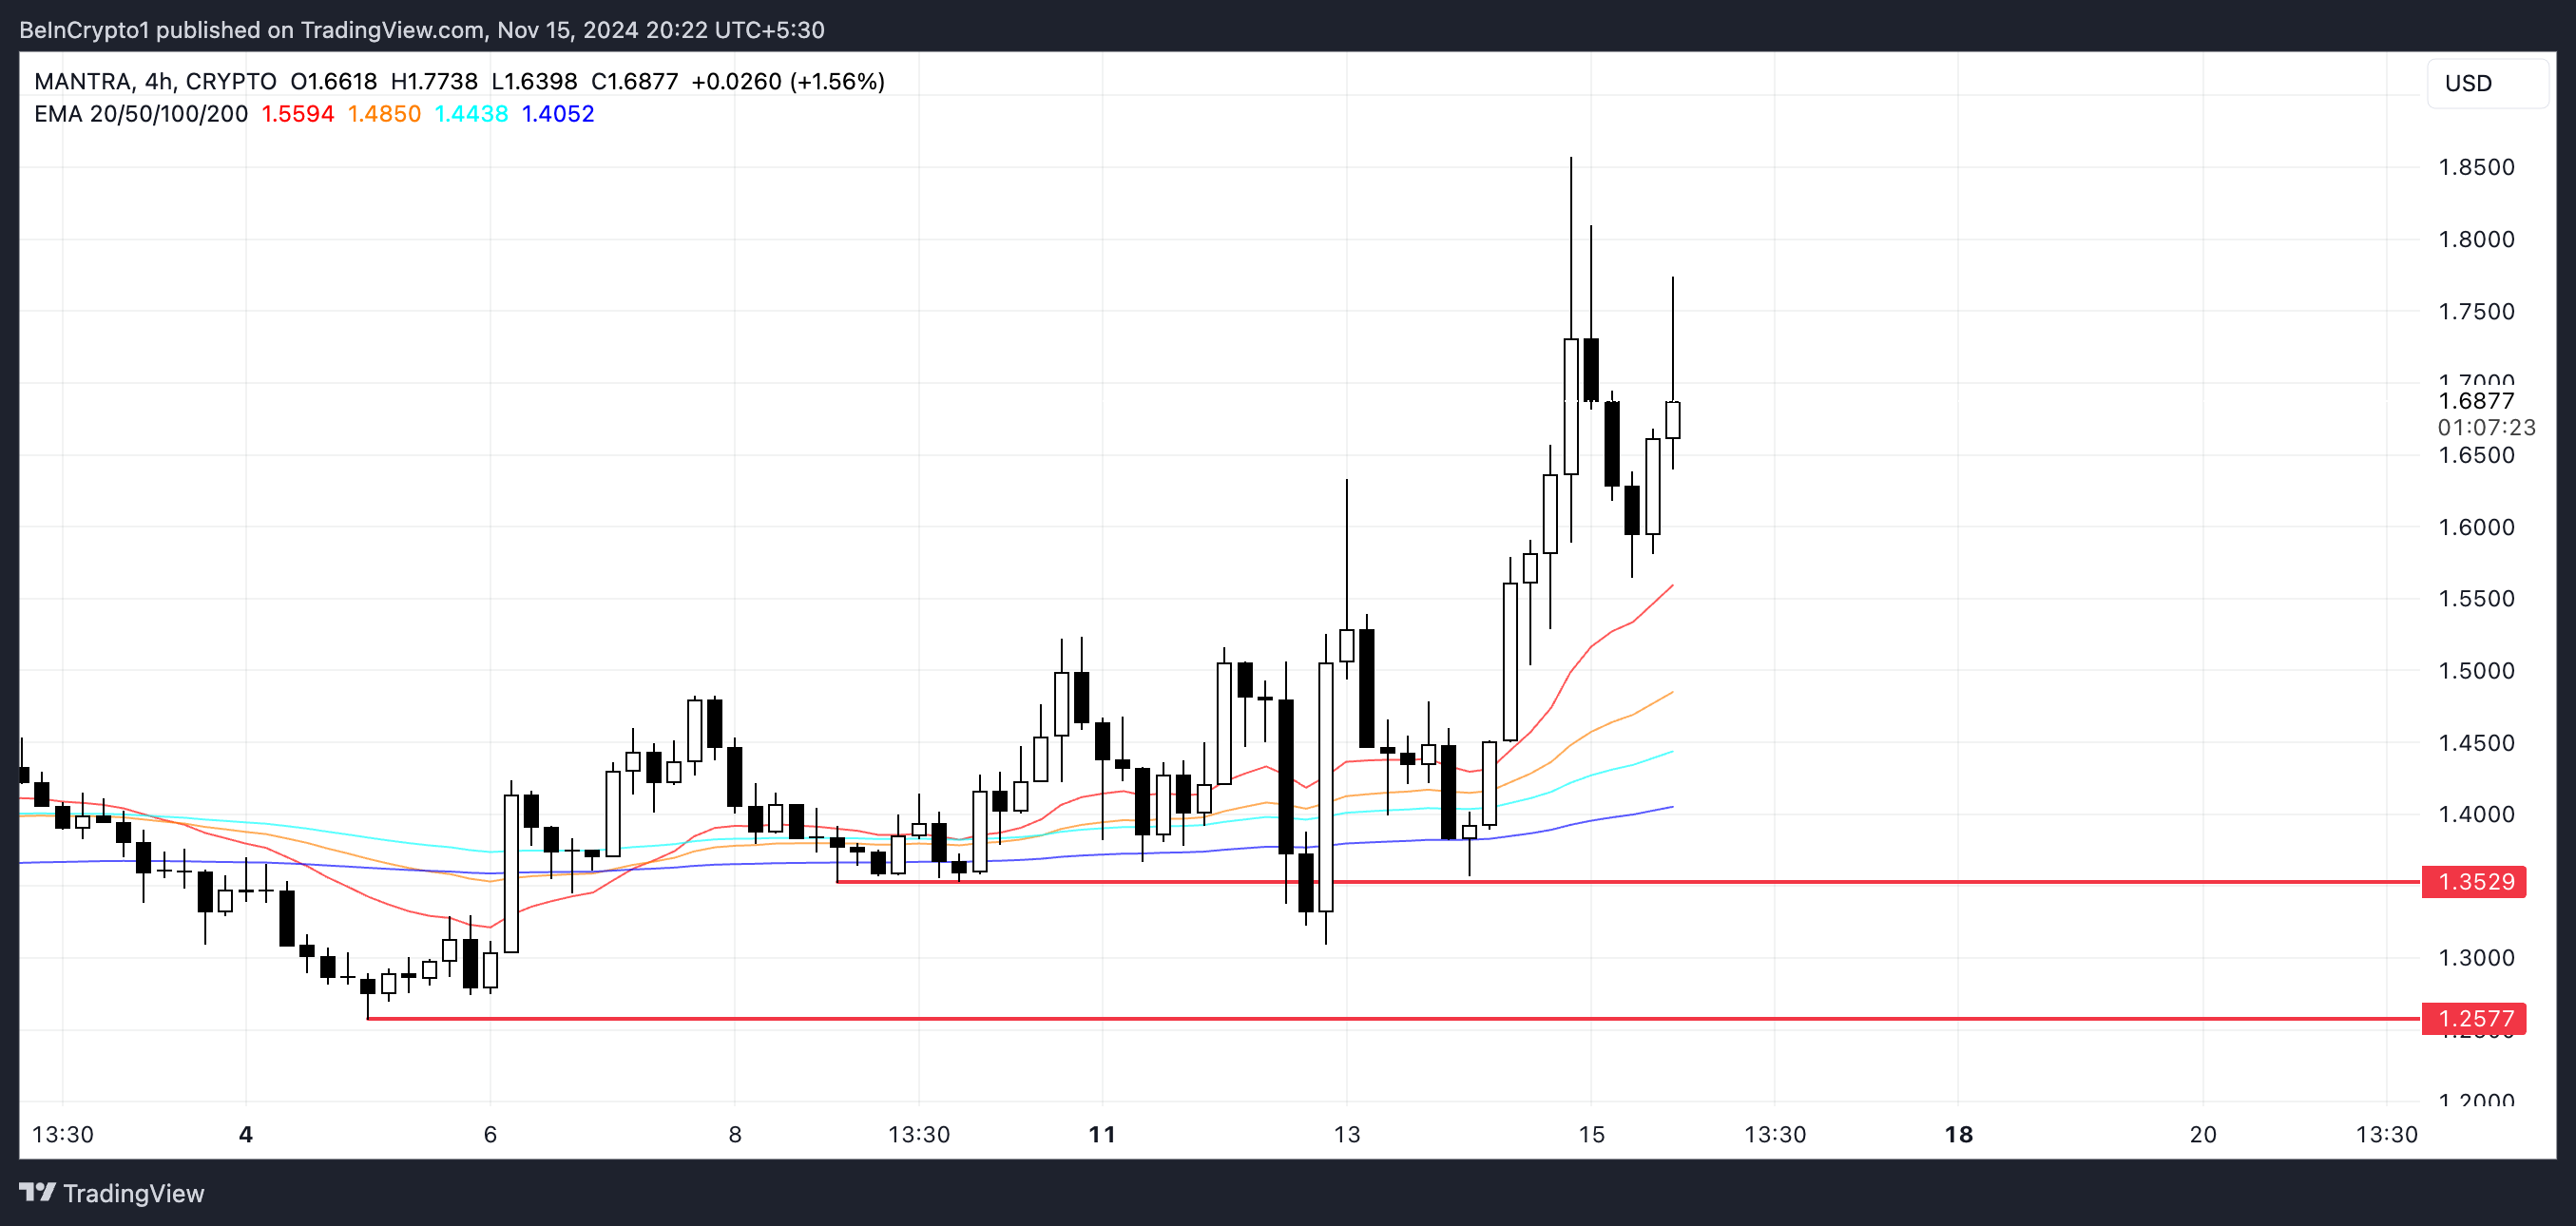
Combining insights from the ADX and Ichimoku Cloud metrics, OM’s recent breakout to a new all-time high of $1.85 could signal the start of an extended rally. If the bullish momentum continues, further attempts at new highs are plausible in the coming days, as the narrative around real-world assets (RWA) recovers traction.
However, if the uptrend falters and reverses, the OM price may test its first strong support zone around $1.35. Should this level fail to hold, the price could decline further, potentially reaching as low as $1.25, a critical area of support.
免责声明:投资有风险,本文并非投资建议,以上内容不应被视为任何金融产品的购买或出售要约、建议或邀请,作者或其他用户的任何相关讨论、评论或帖子也不应被视为此类内容。本文仅供一般参考,不考虑您的个人投资目标、财务状况或需求。TTM对信息的准确性和完整性不承担任何责任或保证,投资者应自行研究并在投资前寻求专业建议。
热议股票
- 1
- 2
- 3
- 4
- 5
- 6
- 7
- 8
- 9
- 10