Solana (SOL) Price Pattern Points to Brief Dip, $260 Target Next
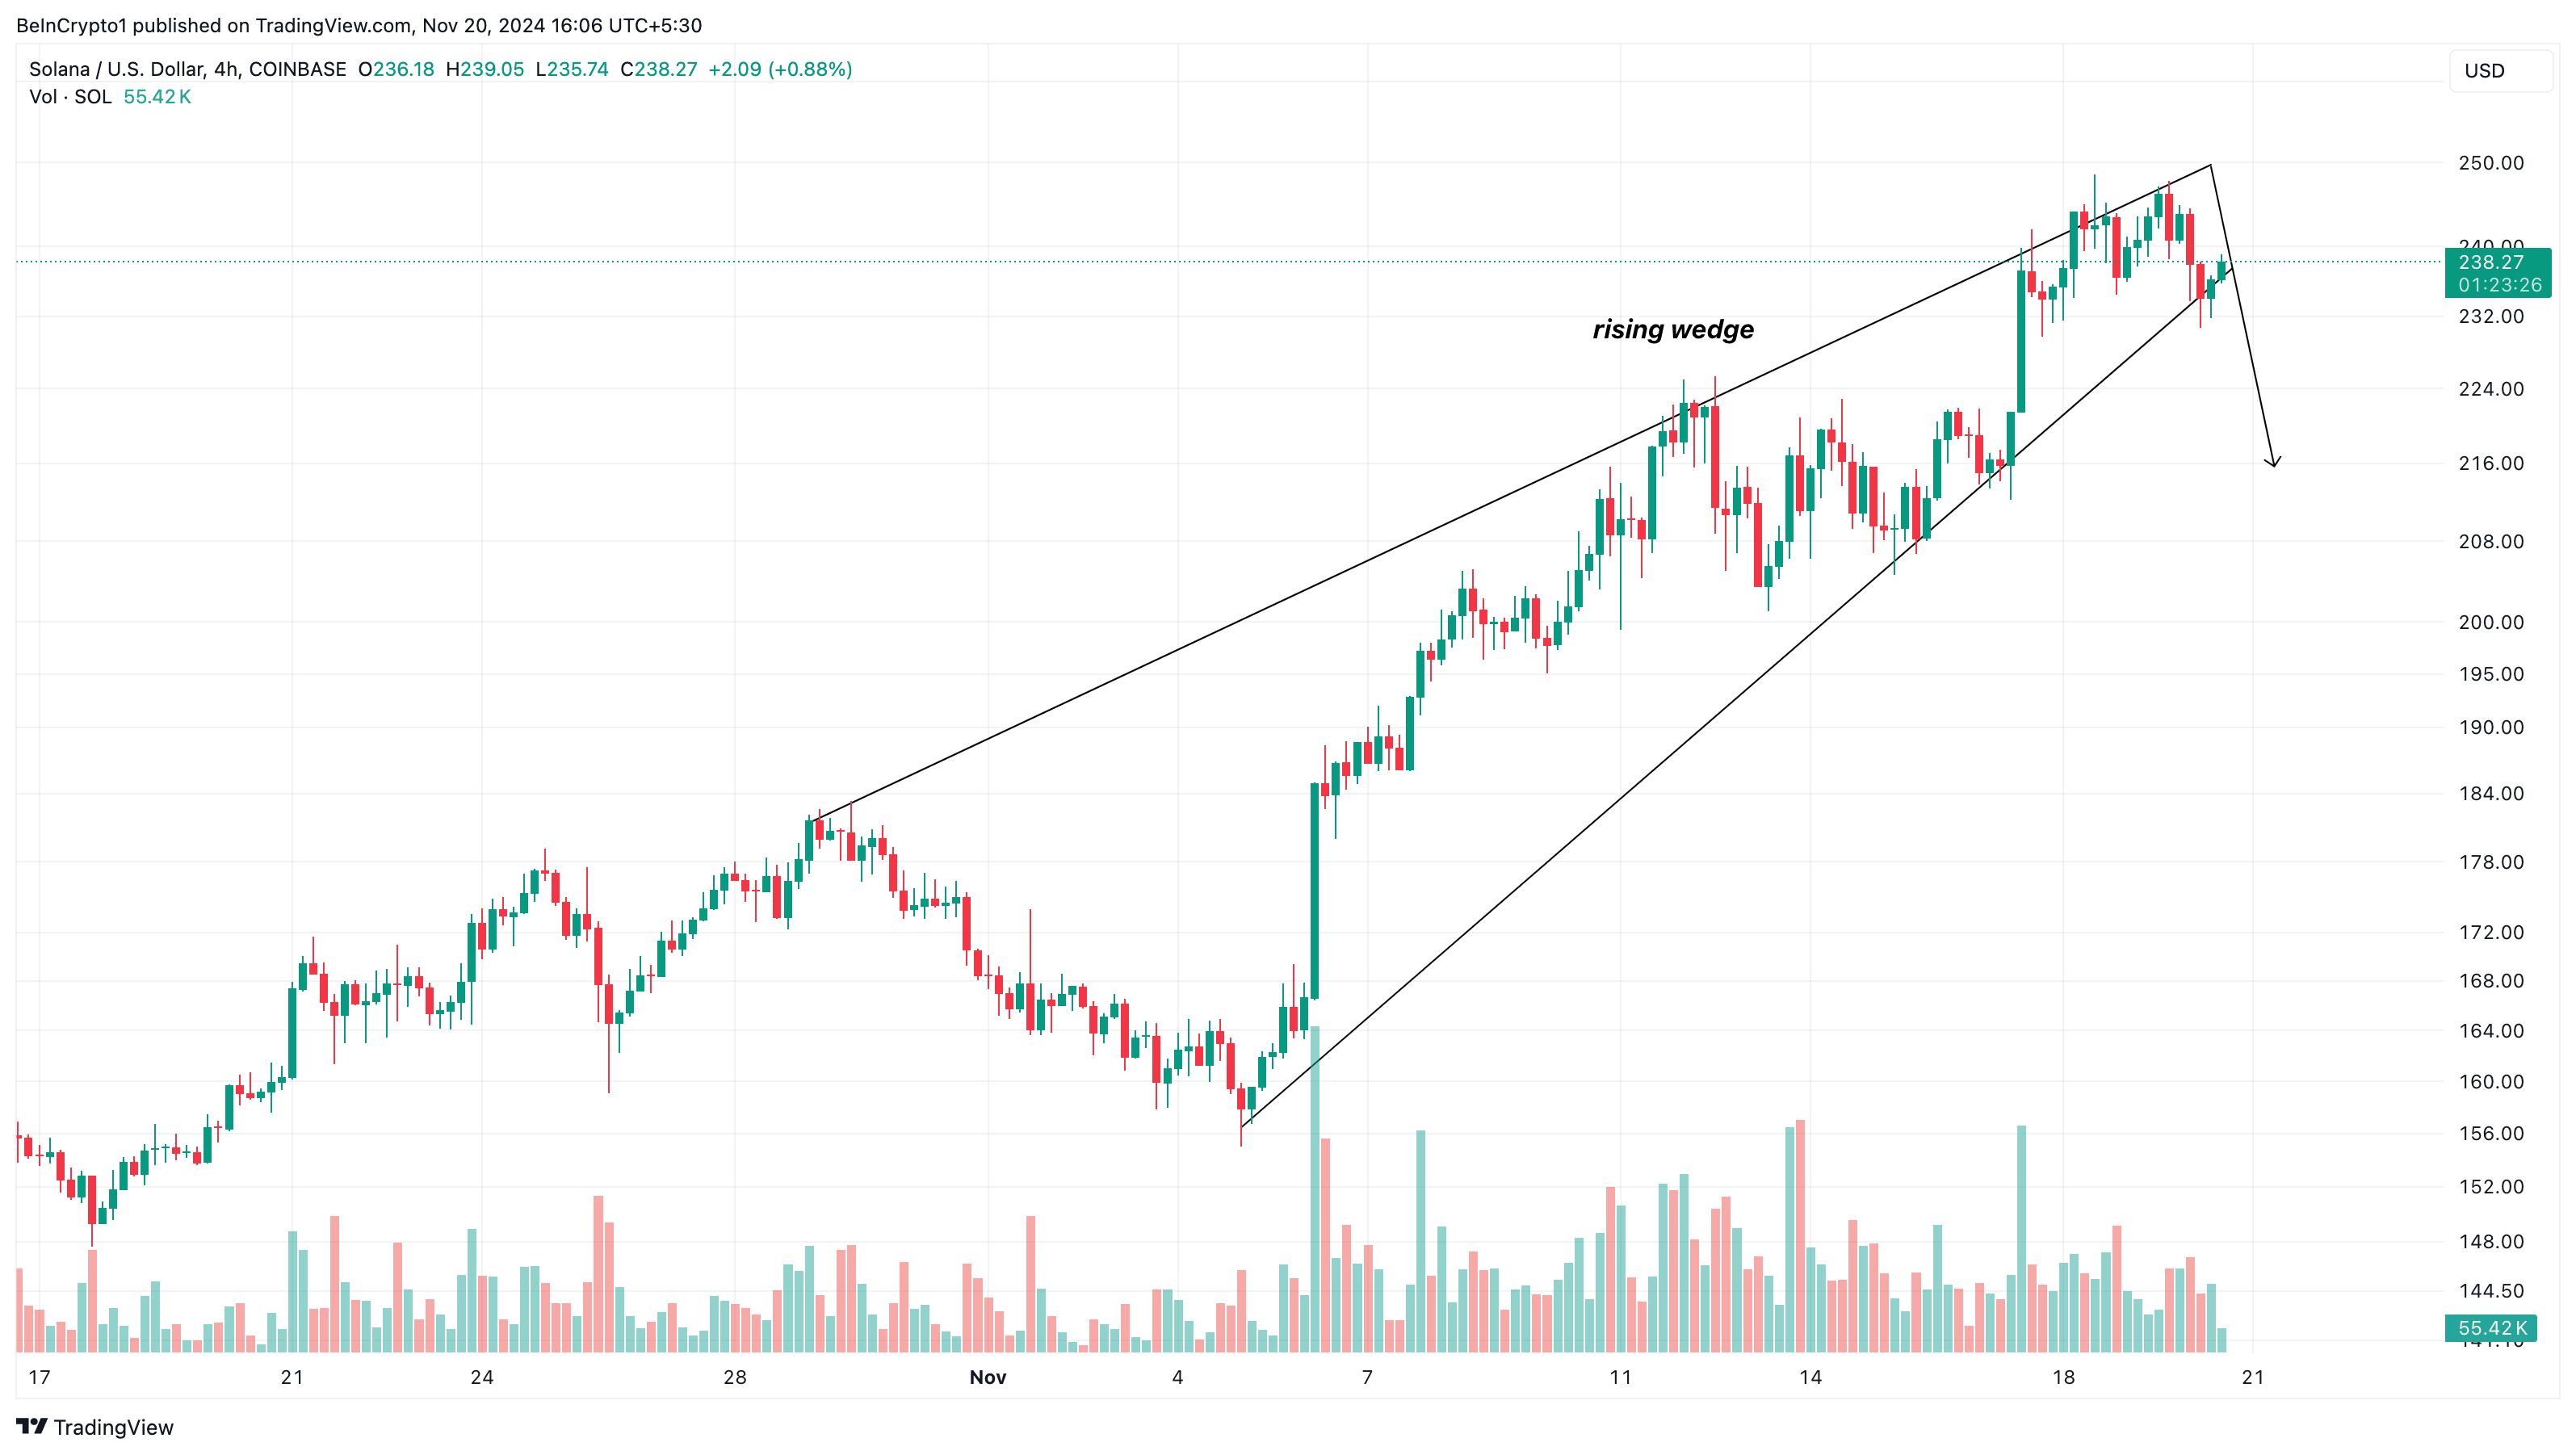
- Solana (SOL) forms a bearish rising wedge on the 4-hour chart, signaling a potential decline after its 155% seven-day rally.
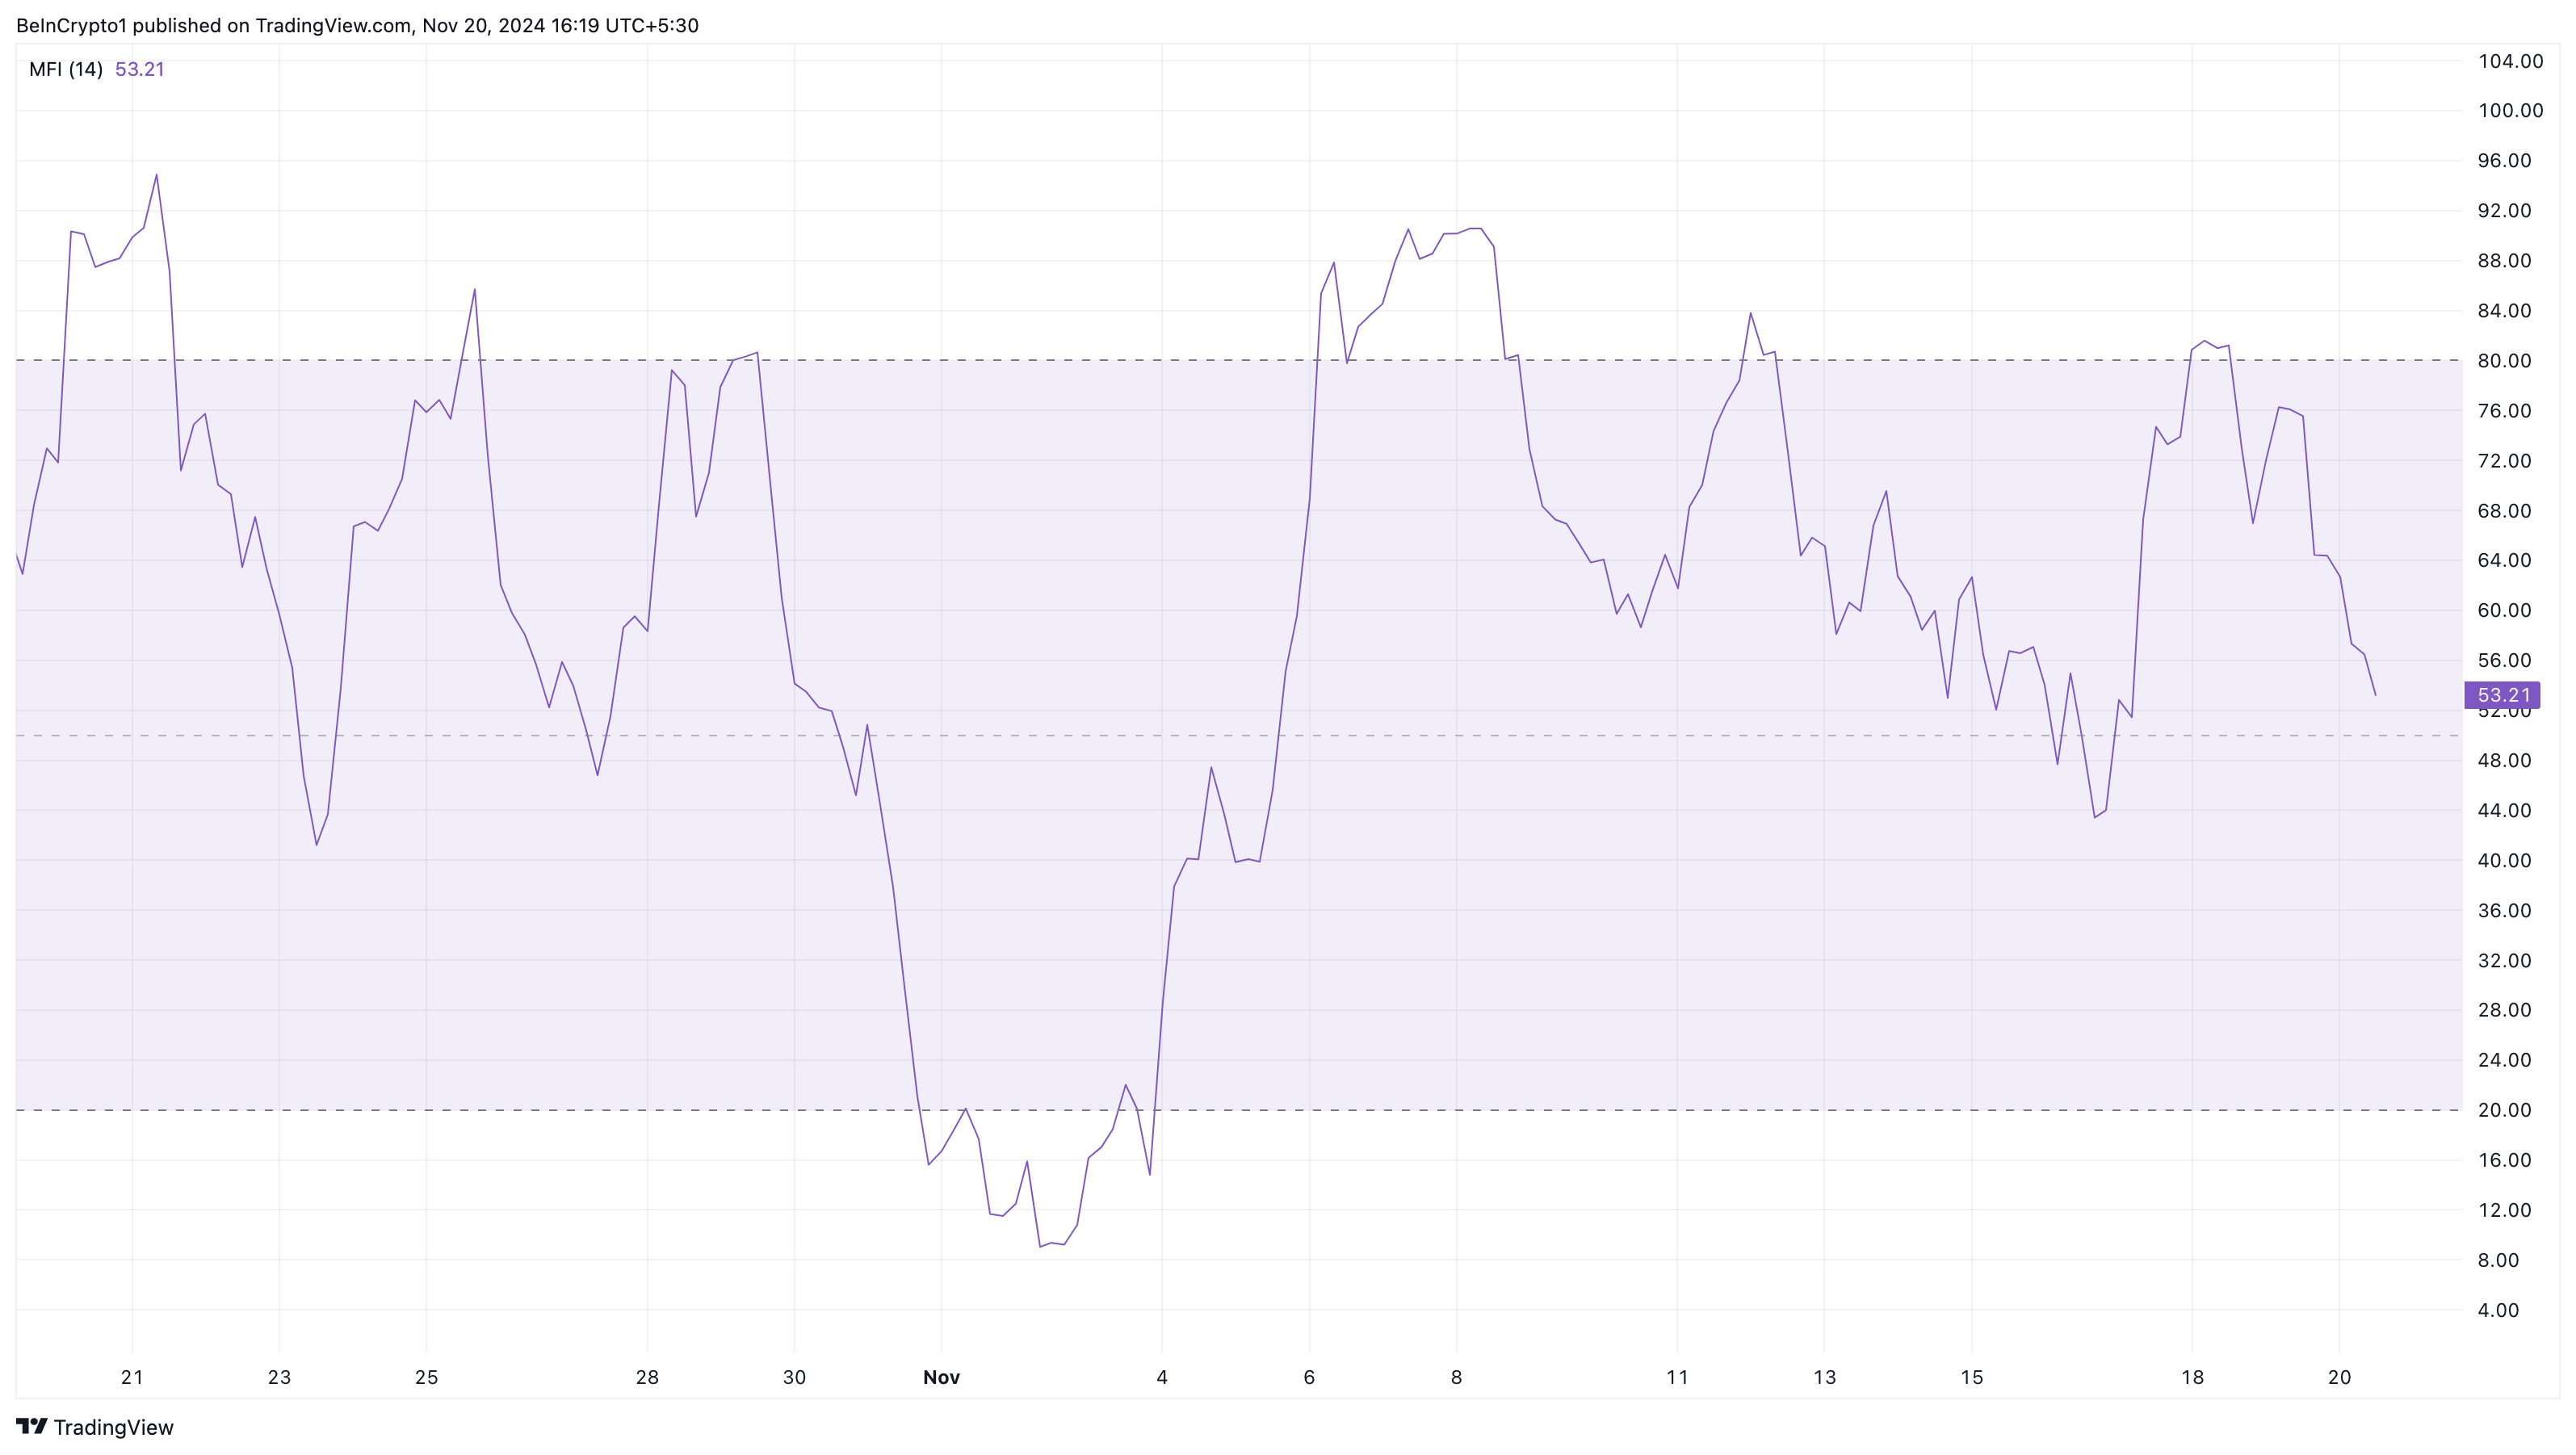
- The Money Flow Index (MFI) shows reduced buying pressure, aligning with the wedge pattern for a possible pullback.
- SOL could dip to $205.12 based on Fibonacci retracement; a breakout above resistance might push it past $260.
Solana’s (SOL) price has formed a rising wedge on the 4-hour chart, suggesting that the altcoin’s value could face a setback before its potential rise toward $260. At press time, SOL’s value is $237.88, representing a 15% hike in the last seven days.
While SOL holders would expect the rally to continue, several technical indicators suggest that they might need to wait a little longer.
Solana Uptrend Pulls Back
On the 4-hour chart, BeInCrypto observed that a Solana rising wedge pattern has appeared. A rising wedge is a technical pattern commonly seen as a bearish signal, suggesting a potential reversal of an uptrend.
Two converging trendlines define the pattern. Here, the lower trendline (support) rises more steeply than the upper trendline (resistance), forming a narrowing channel. When the price breaks below the lower trendline, it confirms the bearish reversal, indicating a potential decline.
However, in some cases, a breakout to the upside can occur, though it is less common. In SOL’s case, it appears that the price is on the cusp of breaking below the lower trendline. Once validated, this could halt the altcoin’s rally, and a notable downturn could be next.
Furthermore, the Money Flow Index (MFI) adds weight to this bearish outlook. Notably, the MFI is a technical indicator that uses price and volume to measure the capital flowing in and out of a cryptocurrency.
A rising MFI indicates strong buying pressure, while a decline highlights sellers’ dominance. Currently, the MFI shows a downward trend, amplifying the bearish sentiment. When paired with the emerging rising wedge pattern, this confluence of signals reinforces the case for a potential decline in Solana’s price.
SOL Price Prediction: $205 Before $260?
On the daily chart, Solana’s price faced resistance at $239.56 as it attempted to climb toward $260. Due to this development, SOL might not find it easy to hit its all-time high in the short-term
The Fibonacci retracement indicator also supports this prediction. For context, the Fib indicator shows a sequence that generates a pattern of steadily increasing numbers that converge toward the price levels where a cryptocurrency might reach
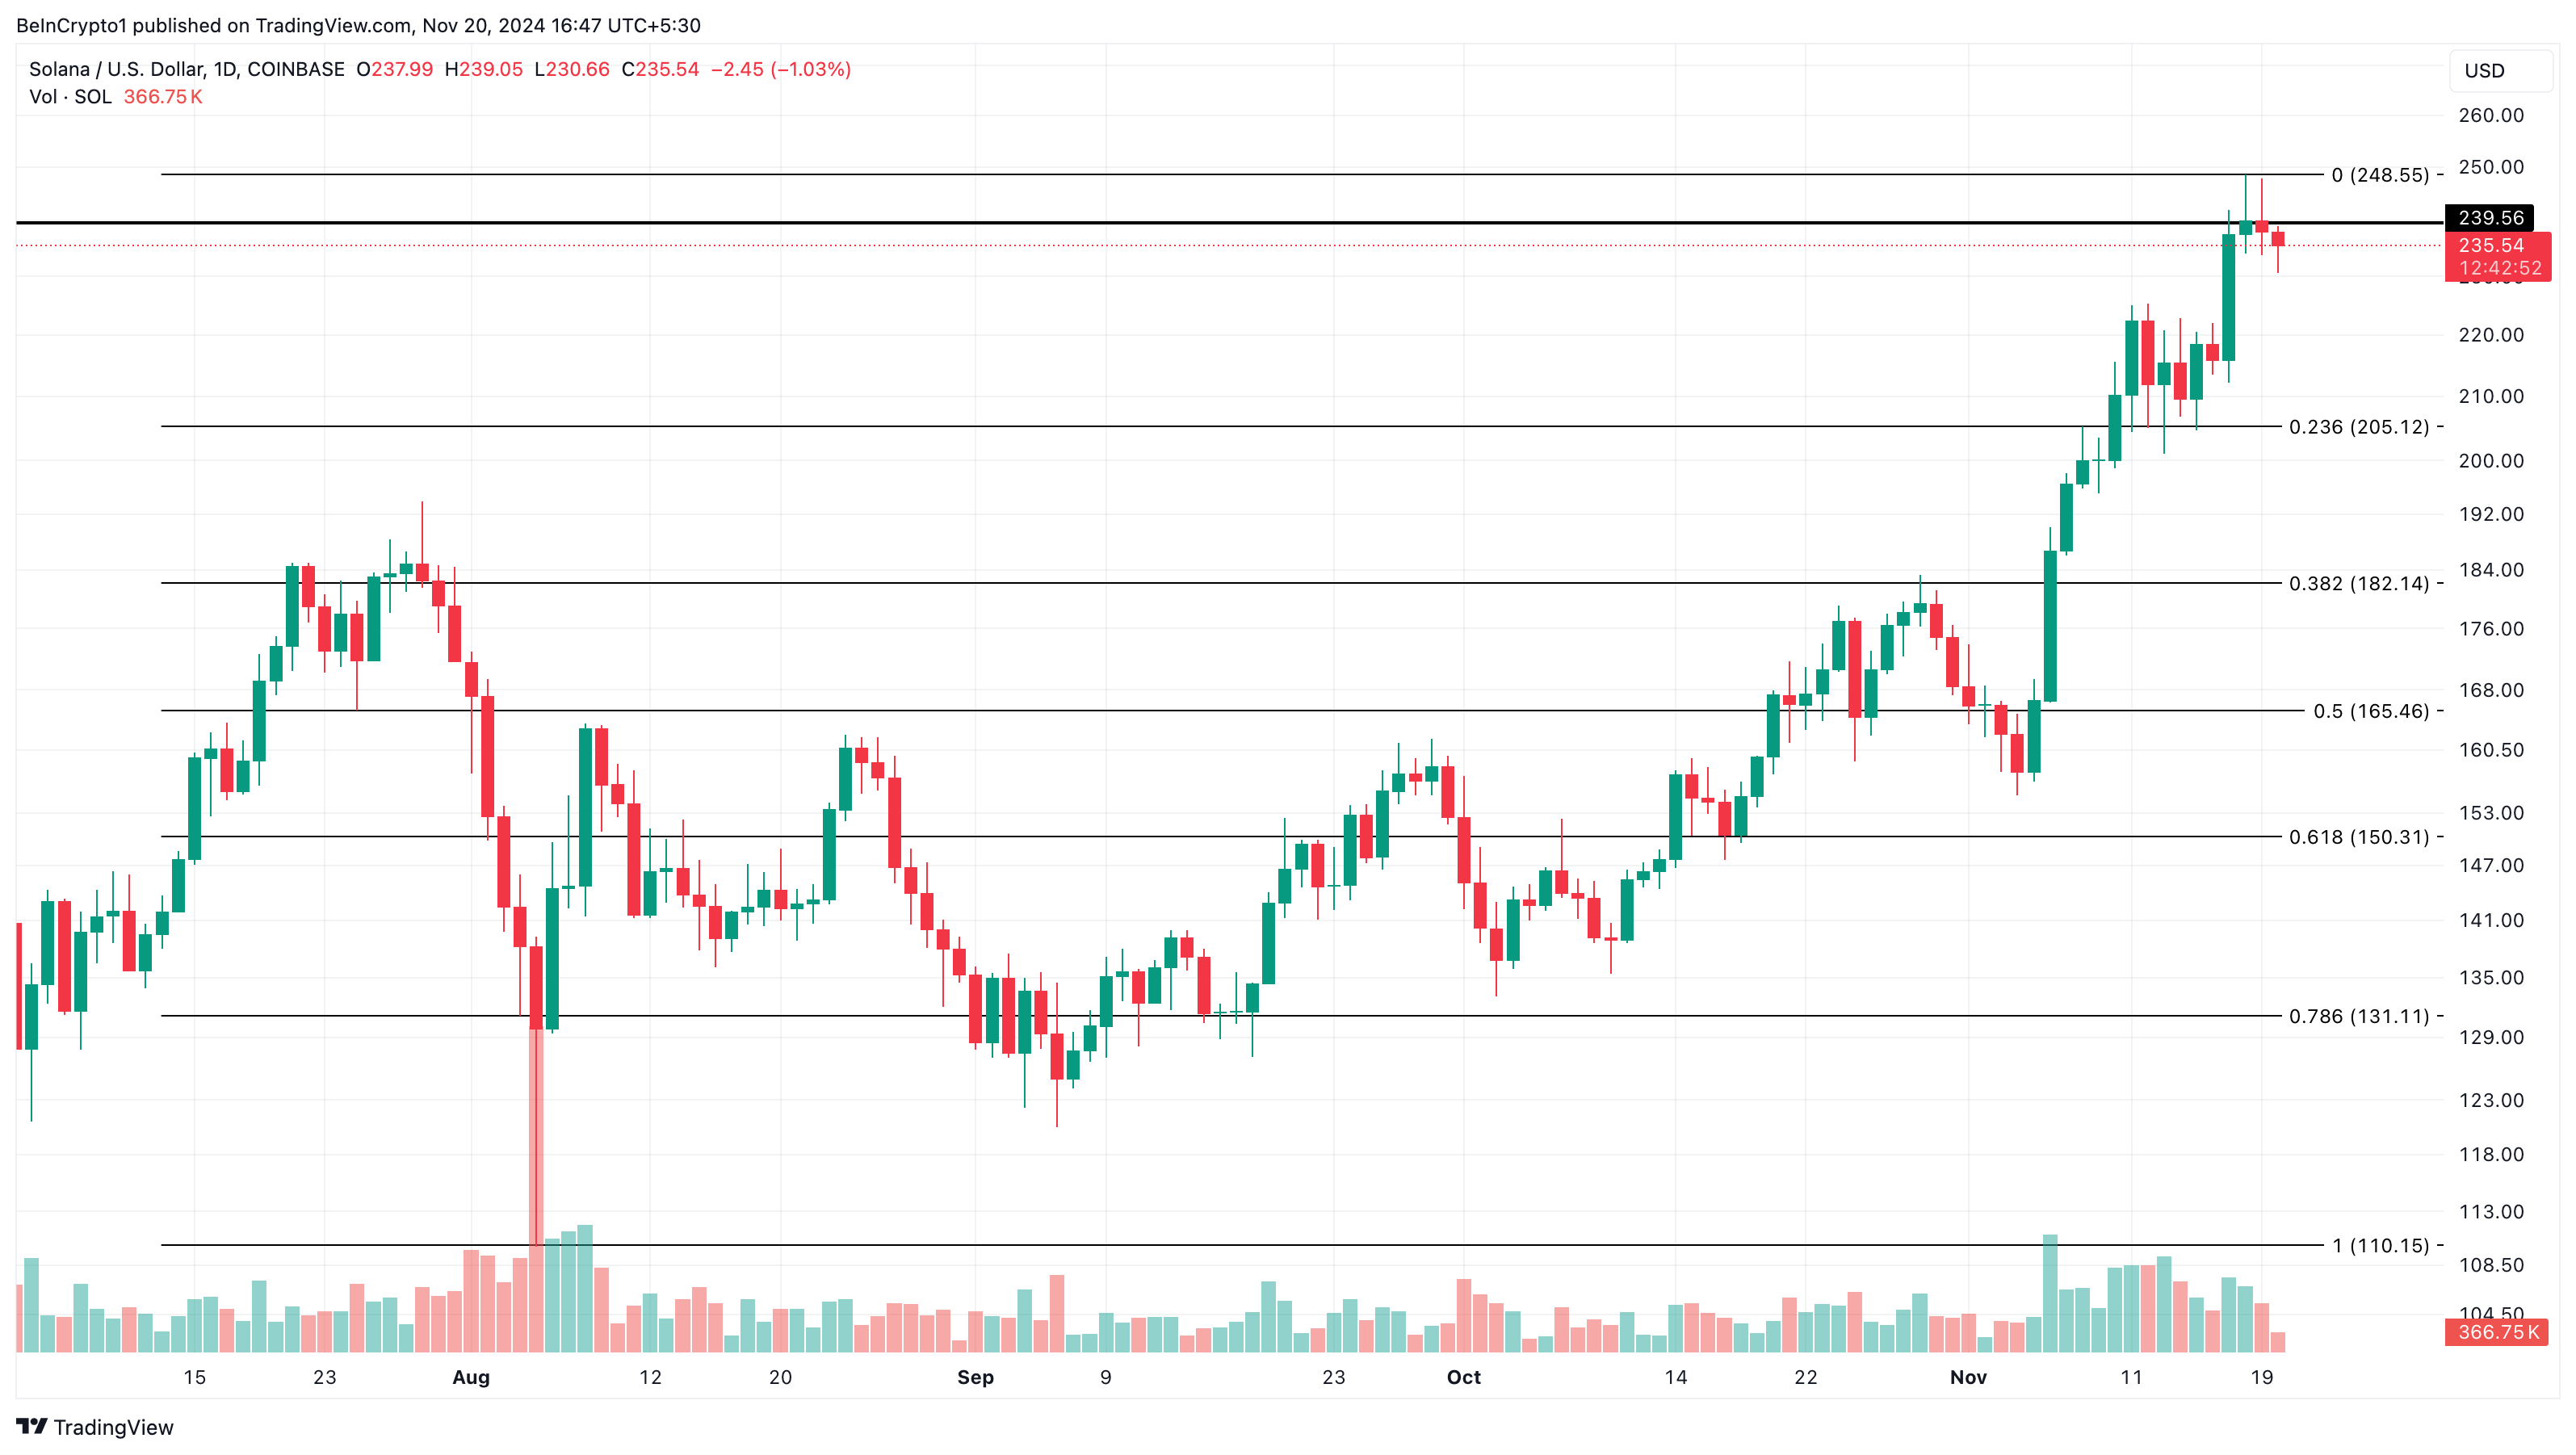
A key one is the 23.6% Fib level, which shows a potential pullback point. Considering the Solana rising wedge and lack of buying pressure, the altcoin’s price could decline to $205.12.
However, if SOL breaks above the upper trendline of the rising wedge, this might not happen. Instead, the token could rise above $260 and hit a new all-time high.
免责声明:投资有风险,本文并非投资建议,以上内容不应被视为任何金融产品的购买或出售要约、建议或邀请,作者或其他用户的任何相关讨论、评论或帖子也不应被视为此类内容。本文仅供一般参考,不考虑您的个人投资目标、财务状况或需求。TTM对信息的准确性和完整性不承担任何责任或保证,投资者应自行研究并在投资前寻求专业建议。
热议股票
- 1
- 2
- 3
- 4
- 5
- 6
- 7
- 8
- 9
- 10