Daily Market Review: BTC, ETH, SAND, MANA, XLM
The bulls are in control of today’s session, as seen from the increase in the global market cap. The total cap stood at $3.38T as of press time, representing a 3.38% increase over the last 24 hours, while the trading volume dropped by 9.32% over the same period to stand at $200.91B as of press time.
Bitcoin Price Review
Bitcoin, $BTC, has failed to post gains in today’s session, as seen from its price movements. Looking at an in-depth analysis, the Bitcoin price is testing the upper Bollinger Band, which often acts as resistance. A failure to break above might lead to a price retraction towards the middle or lower band.
On the other hand, we see that Awesome Oscillator (AO) is showing green bars decreasing in height, which could suggest that the bullish momentum is waning. Bitcoin traded at $98,396 as of press time, representing a 0.09% decrease over the last 24 hours.
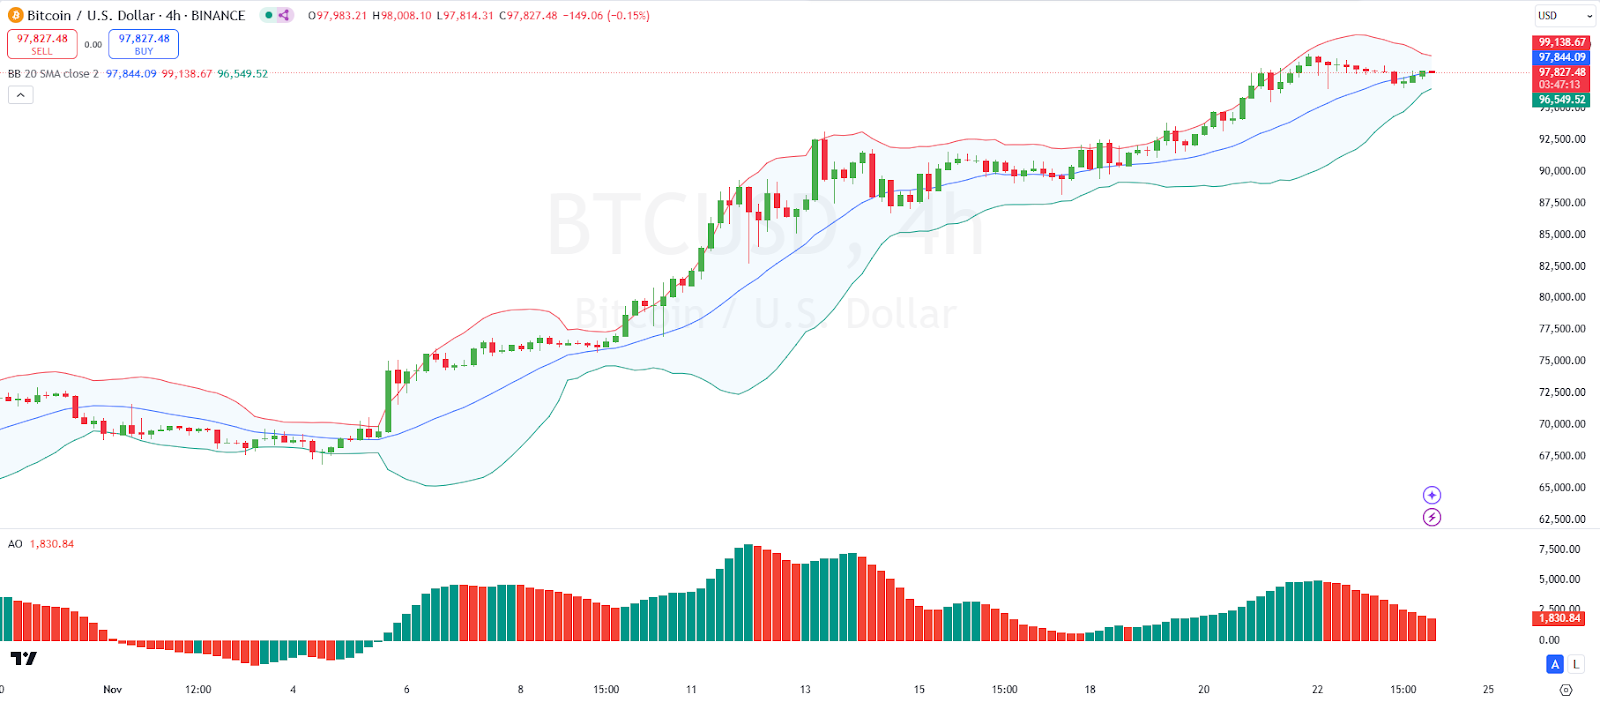
4-hour BTC|USD Chart | Source: TradingView
Ethereum Price Review
Ethereum, $ETH, is among the gainers in today’s session as also seen from its price movements. Looking at an in-depth analysis, we see that Ethereum’s price is above all key moving averages (50, 100, and 200 SMA), indicating a strong bullish trend in the medium term.
Looking at other indicators, we see that Money Flow Index (MFI), the MFI is also above 60, supporting the presence of strong buying pressure. Ethereum traded at $3,415 as of press time, representing a 0.49% increase over the last 24 hours.
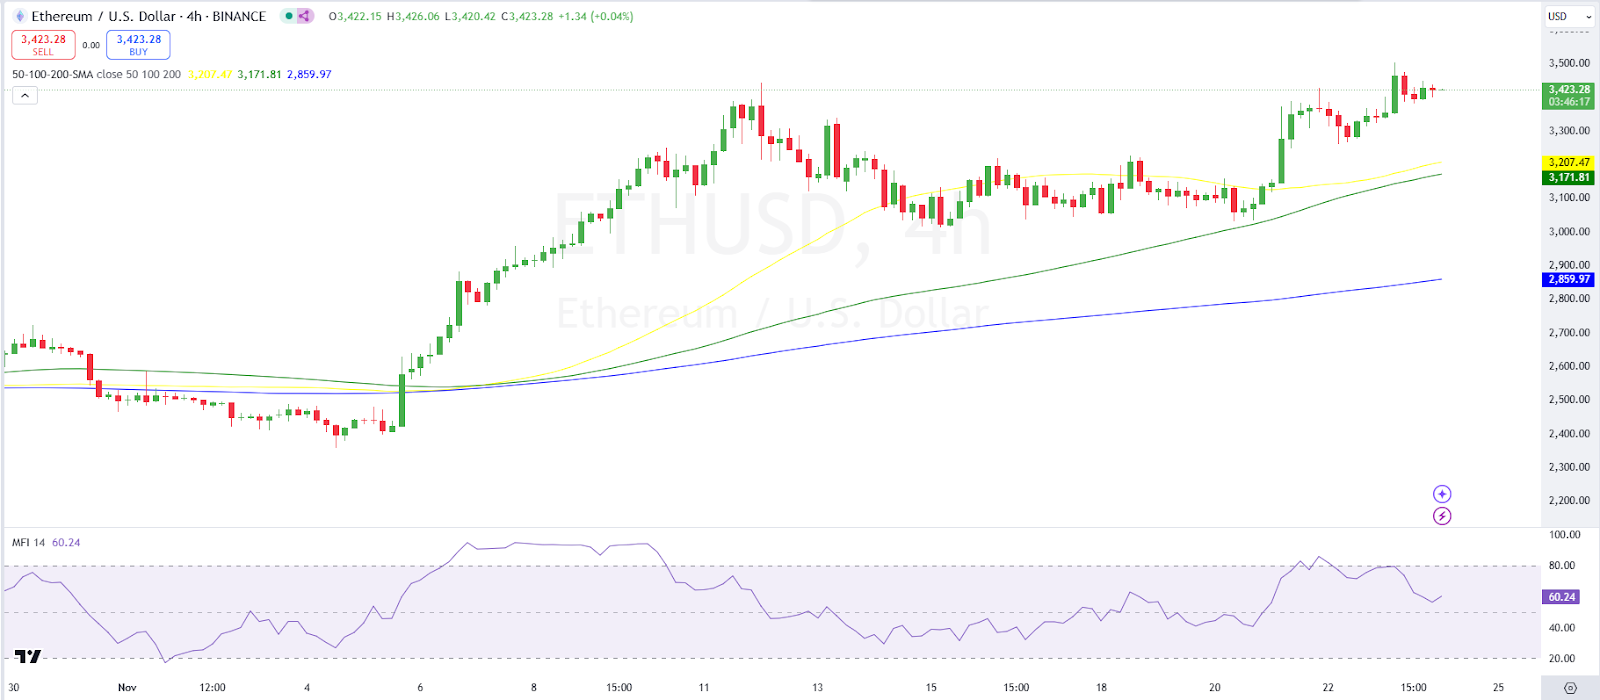
4-hour ETH/USD Chart | Source: TradingView
The Sandbox Price Review
The Sandbox, $SAND, is also among the gainers in today’s session as also seen from its price movements.Looking at an in-depth analysis, we see that the Sandbox price has broken above the Ichimoku Cloud, indicating a bullish reversal in trend.
On the other hand, we see that the ADX (Average Directional Index) is above 50, suggesting a very strong trend currently in place. Sandbox traded at $0.6278 as of press time, representing a 58.76% increase over the last 24 hours.
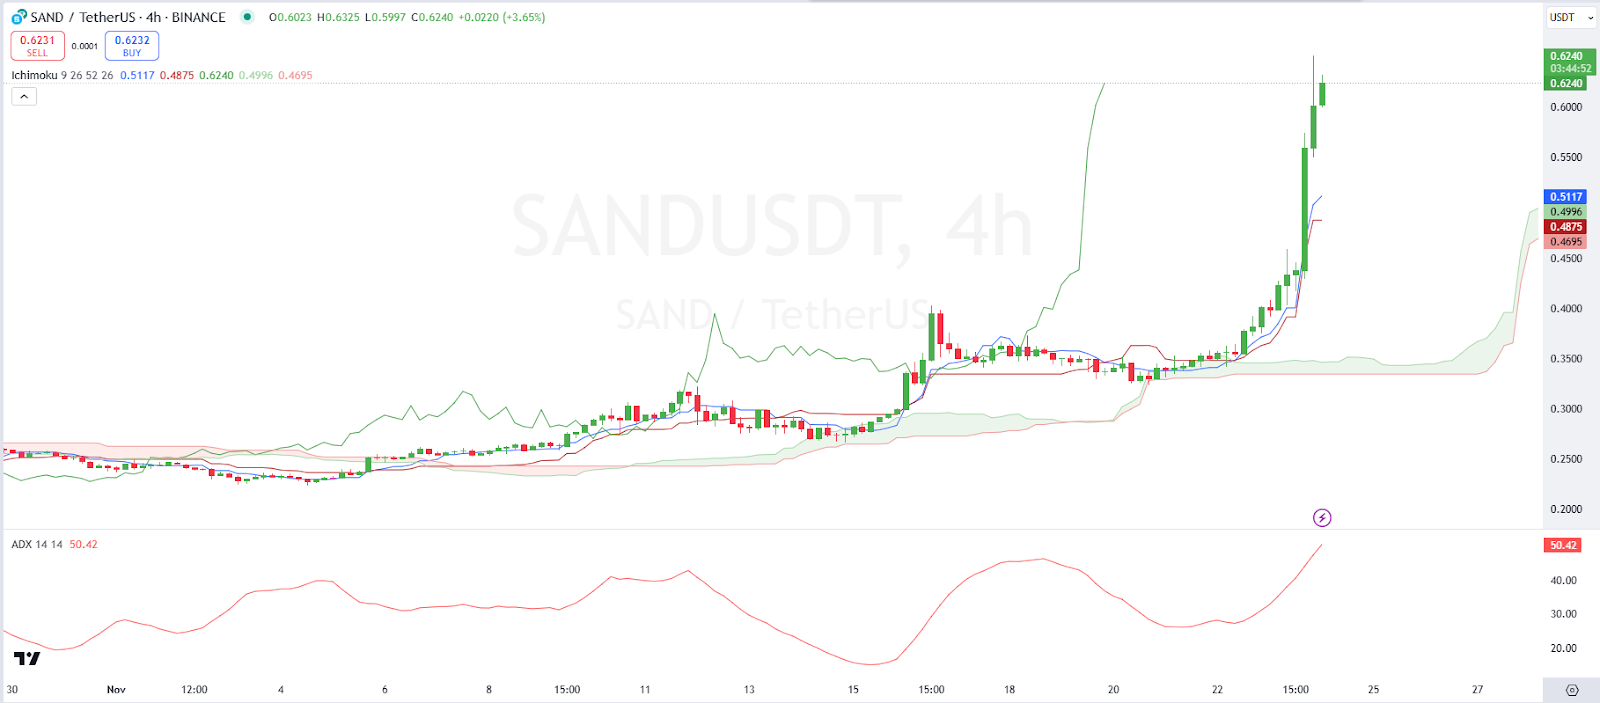
4-hour STX/USDT Chart | Source: TradingView
Decentraland Price Review
Decentraland, $MANA, is also among the gainers in today’s session as also seen from its price movements. Looking at an in-depth analysis, we see that the Decentraland price is above the Supertrend line, signaling a bullish market condition.
On the other hand, we see that the MFI is high (above 90), which may indicate overbought conditions that could lead to a potential price pullback or consolidation. Decentraland traded at $0.6961 as of press time, representing a 42.11% increase over the last 24 hours.
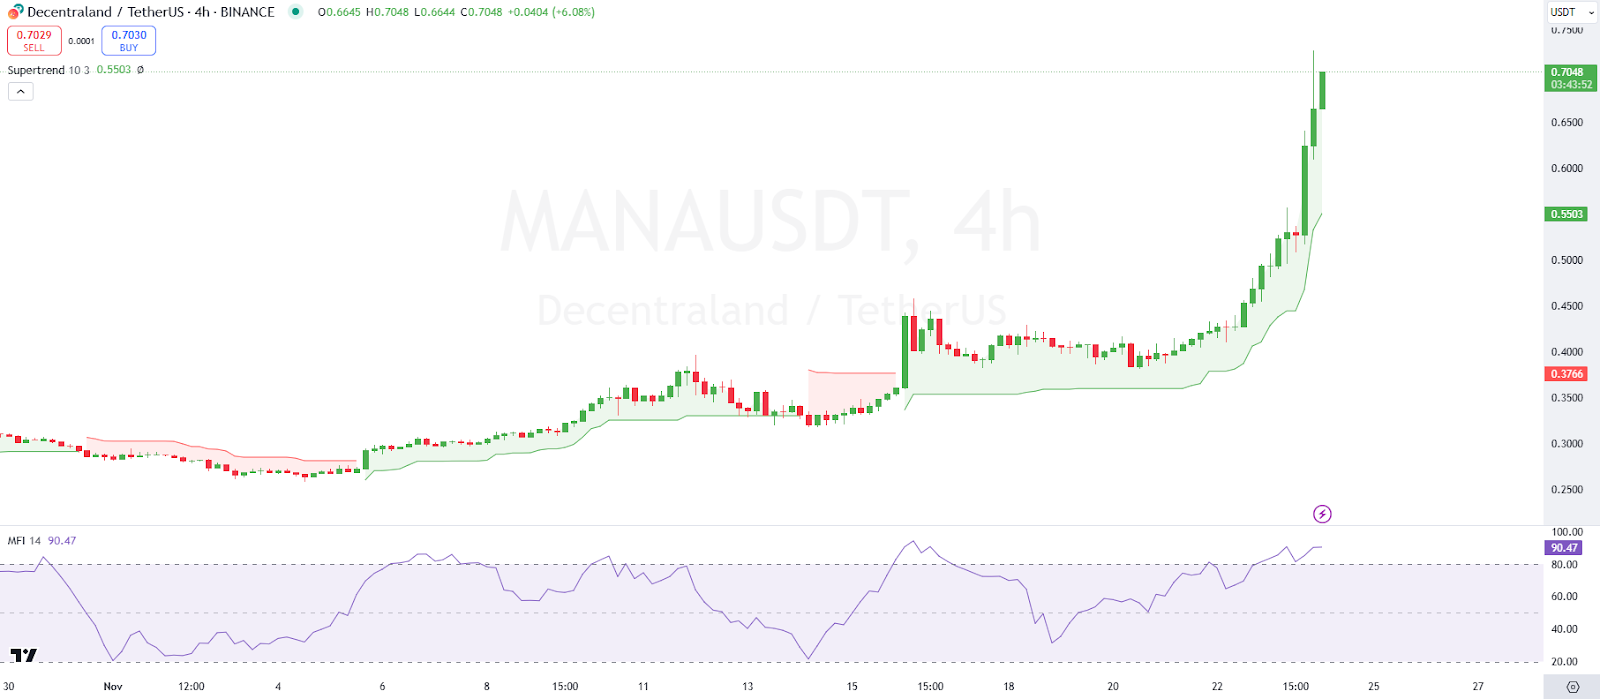
4-hour MANA/USDT Chart | Source: TradingView
Stellar Price Review
Stellar, $XLM, is also among the gainers in today’s session as also seen from its price movements. Looking at an in-depth analysis, we see that the jaws, teeth, and lips of the Alligator are wide open and aligned properly, signaling a strong bullish trend.
On the other hand, we see that the MFI is near 92 also signals that the market might be approaching overbought territory, potentially leading to a pullback. Stellar traded at $0.5723 as of press time, representing a 27.00% increase over the last 24 hours.
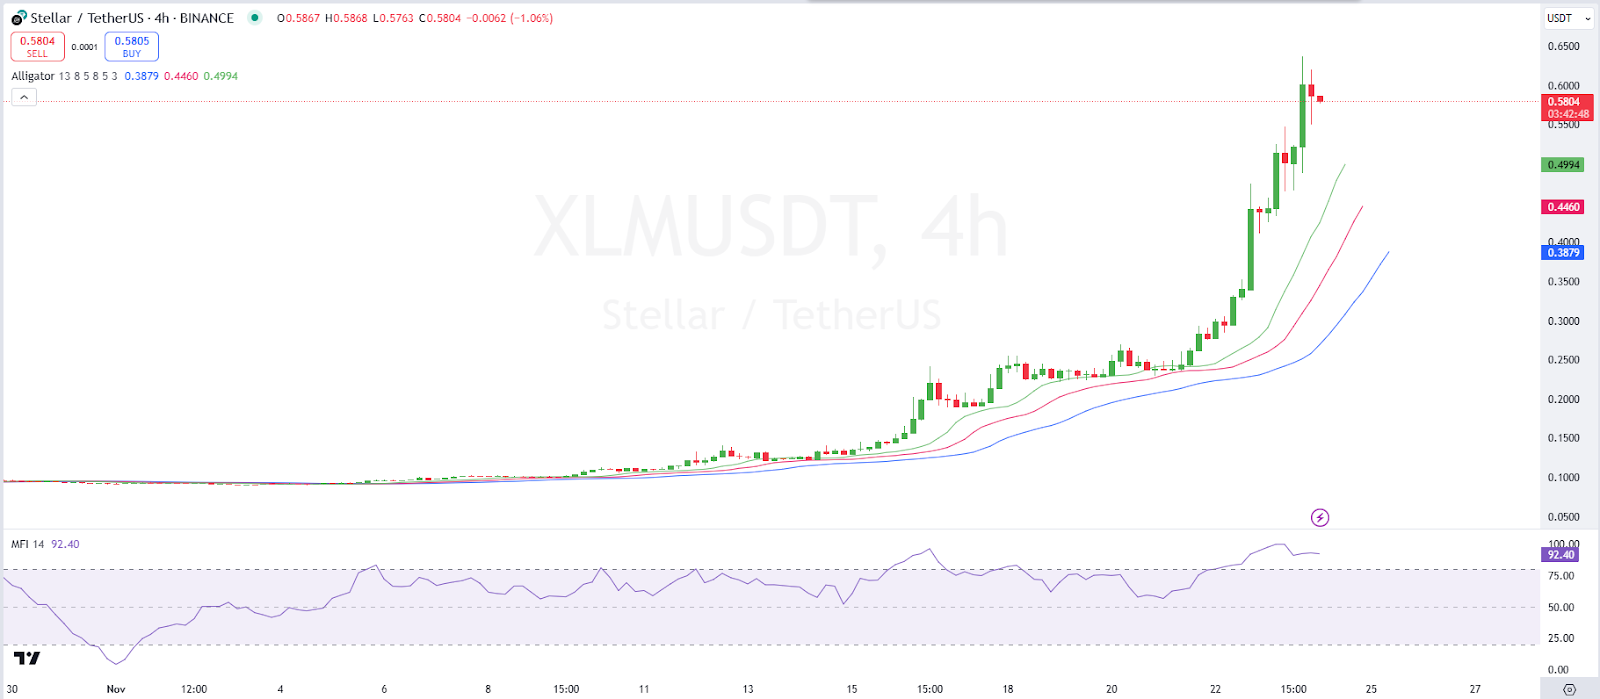
4-hour XLM/USDT Chart | Source: TradingView
免责声明:投资有风险,本文并非投资建议,以上内容不应被视为任何金融产品的购买或出售要约、建议或邀请,作者或其他用户的任何相关讨论、评论或帖子也不应被视为此类内容。本文仅供一般参考,不考虑您的个人投资目标、财务状况或需求。TTM对信息的准确性和完整性不承担任何责任或保证,投资者应自行研究并在投资前寻求专业建议。
热议股票
- 1
- 2
- 3
- 4
- 5
- 6
- 7
- 8
- 9
- 10