United Energy Group And 2 Other Promising Penny Stocks To Watch
As global markets react to the uncertainties surrounding new political administrations and shifting economic policies, investors continue to seek opportunities that align with current trends. Penny stocks, despite their somewhat outdated moniker, remain an intriguing area for those interested in smaller or newer companies that might offer growth potential. These stocks can be particularly appealing when they are supported by strong financials, providing a foundation for potential long-term success.
Top 10 Penny Stocks
| Name | Share Price | Market Cap | Financial Health Rating |
| BP Plastics Holding Bhd (KLSE:BPPLAS) | MYR1.23 | MYR346.22M | ★★★★★★ |
| DXN Holdings Bhd (KLSE:DXN) | MYR0.485 | MYR2.41B | ★★★★★★ |
| Rexit Berhad (KLSE:REXIT) | MYR0.77 | MYR133.38M | ★★★★★★ |
| Lever Style (SEHK:1346) | HK$0.87 | HK$539.57M | ★★★★★★ |
| LaserBond (ASX:LBL) | A$0.585 | A$68.57M | ★★★★★★ |
| ME Group International (LSE:MEGP) | £2.115 | £796.86M | ★★★★★★ |
| Hil Industries Berhad (KLSE:HIL) | MYR0.88 | MYR292.11M | ★★★★★★ |
| Next 15 Group (AIM:NFG) | £3.76 | £373.95M | ★★★★☆☆ |
| Embark Early Education (ASX:EVO) | A$0.80 | A$146.79M | ★★★★☆☆ |
| CSE Global (SGX:544) | SGD0.43 | SGD303.74M | ★★★★★☆ |
Click here to see the full list of 5,801 stocks from our Penny Stocks screener.
Underneath we present a selection of stocks filtered out by our screen.
United Energy Group (SEHK:467)
Simply Wall St Financial Health Rating: ★★★★★★
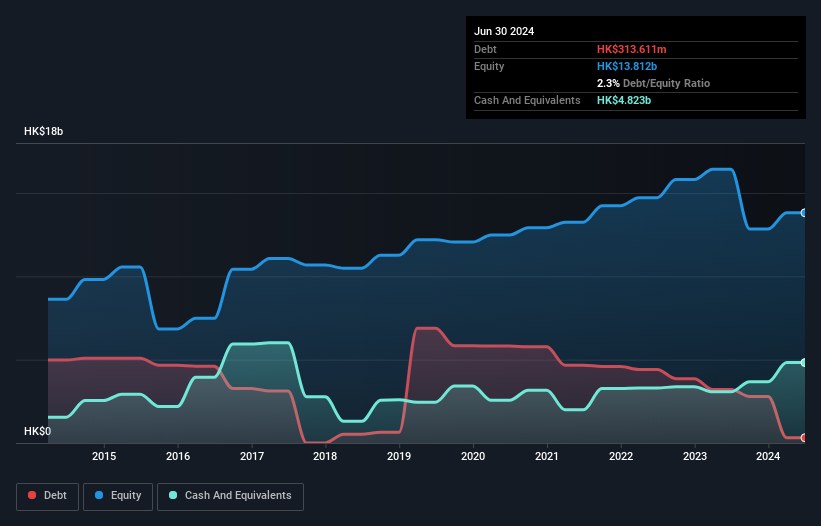
Overview: United Energy Group Limited is an investment holding company involved in the upstream oil, natural gas, and energy sectors across South Asia, the Middle East, and North Africa with a market cap of HK$8.14 billion.
Operations: The company's revenue is primarily derived from two segments: Trading, which generated HK$5.34 billion, and Exploration and Production, contributing HK$10.47 billion.
Market Cap: HK$8.14B
United Energy Group Limited, with a market cap of HK$8.14 billion, operates in the oil and gas sector across South Asia, the Middle East, and North Africa. Despite its unprofitability and negative return on equity (-17.09%), it has managed to maintain strong liquidity with short-term assets of HK$12.6 billion exceeding both short-term (HK$10.6 billion) and long-term liabilities (HK$2.9 billion). The company recently reported half-year sales of HK$8.44 billion but saw a decline in net income to HK$1.01 billion from the previous year’s HK$1.66 billion, highlighting ongoing profitability challenges amidst stable revenue streams from trading and exploration activities.
- Navigate through the intricacies of United Energy Group with our comprehensive balance sheet health report here.
- Review our growth performance report to gain insights into United Energy Group's future.
Star CM Holdings (SEHK:6698)
Simply Wall St Financial Health Rating: ★★★★★★
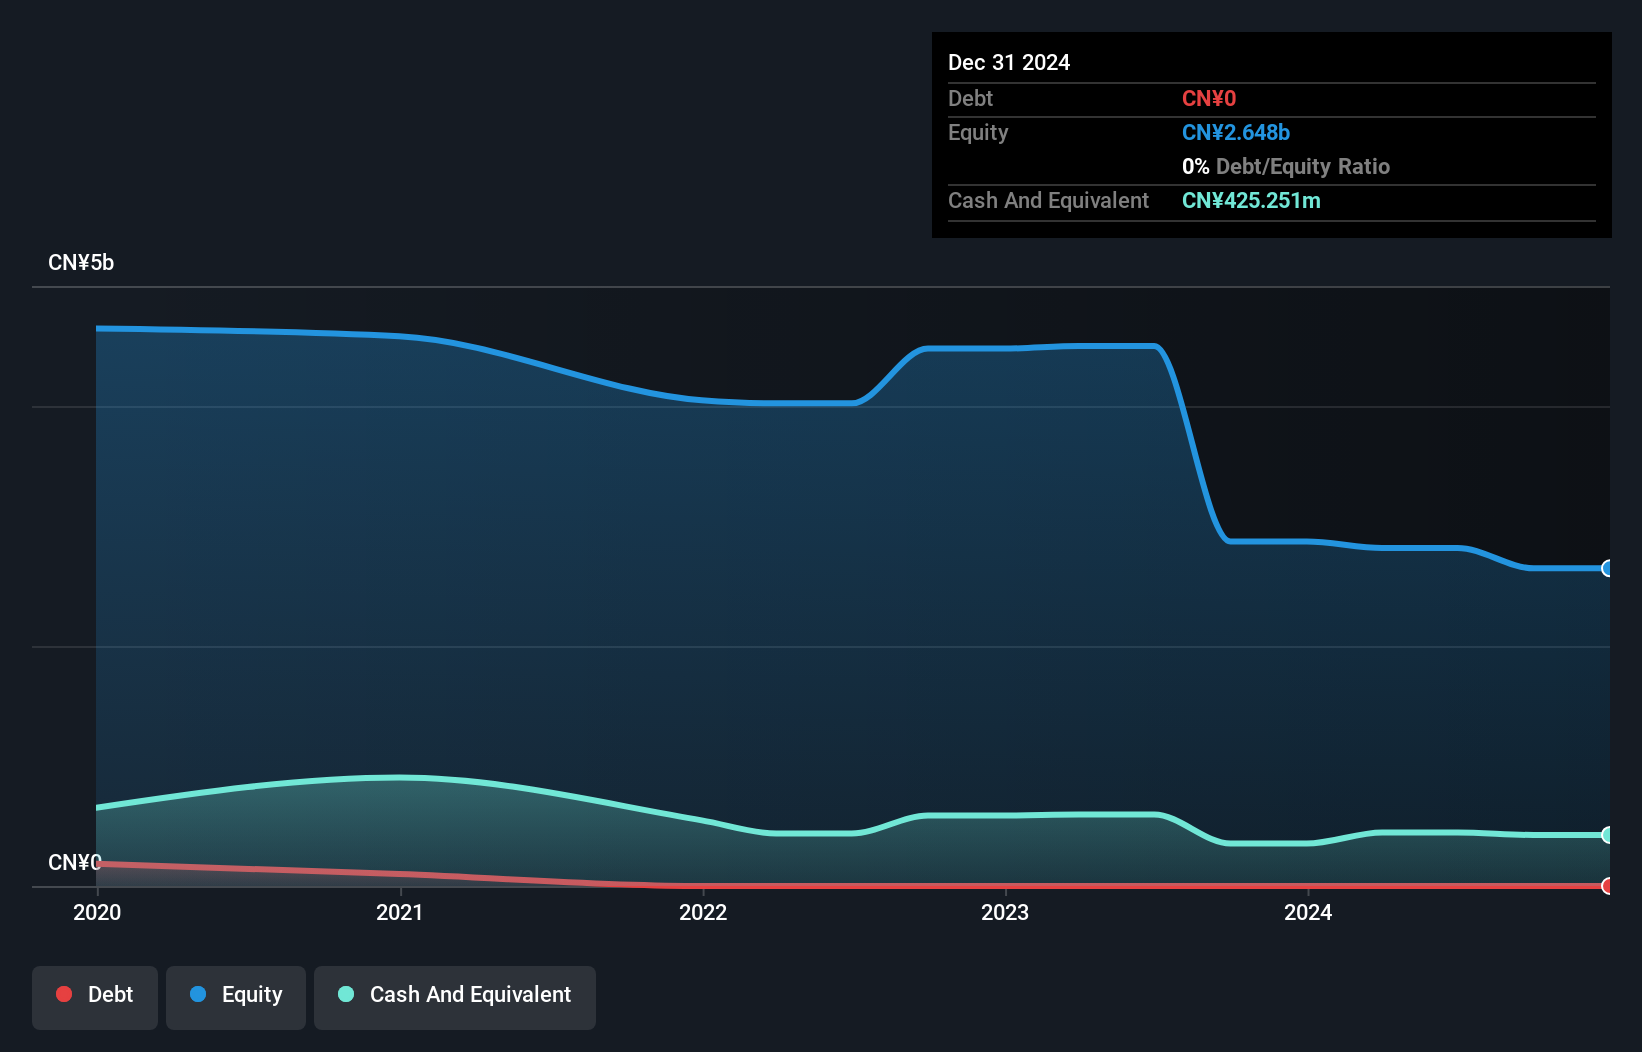
Overview: Star CM Holdings Limited focuses on producing, operating, and licensing variety program intellectual properties in China, with a market cap of approximately HK$1.74 billion.
Operations: The company generates revenue primarily from its Diversified - Media & Entertainment segment, amounting to CN¥353.61 million.
Market Cap: HK$1.74B
Star CM Holdings, with a market cap of HK$1.74 billion, operates within China's media and entertainment sector, generating CN¥353.61 million in revenue primarily from variety program intellectual properties. Despite being debt-free and having short-term assets of CN¥1.2 billion that exceed its liabilities, the company is unprofitable with losses increasing at 68.5% annually over five years and a negative return on equity of -59.39%. Its share price has been highly volatile recently, and it was removed from the S&P Global BMI Index in September 2024, reflecting potential investor concerns about its financial health and growth prospects.
- Unlock comprehensive insights into our analysis of Star CM Holdings stock in this financial health report.
- Gain insights into Star CM Holdings' historical outcomes by reviewing our past performance report.
Shaanxi Beiyuan Chemical Industry Group (SHSE:601568)
Simply Wall St Financial Health Rating: ★★★★★★
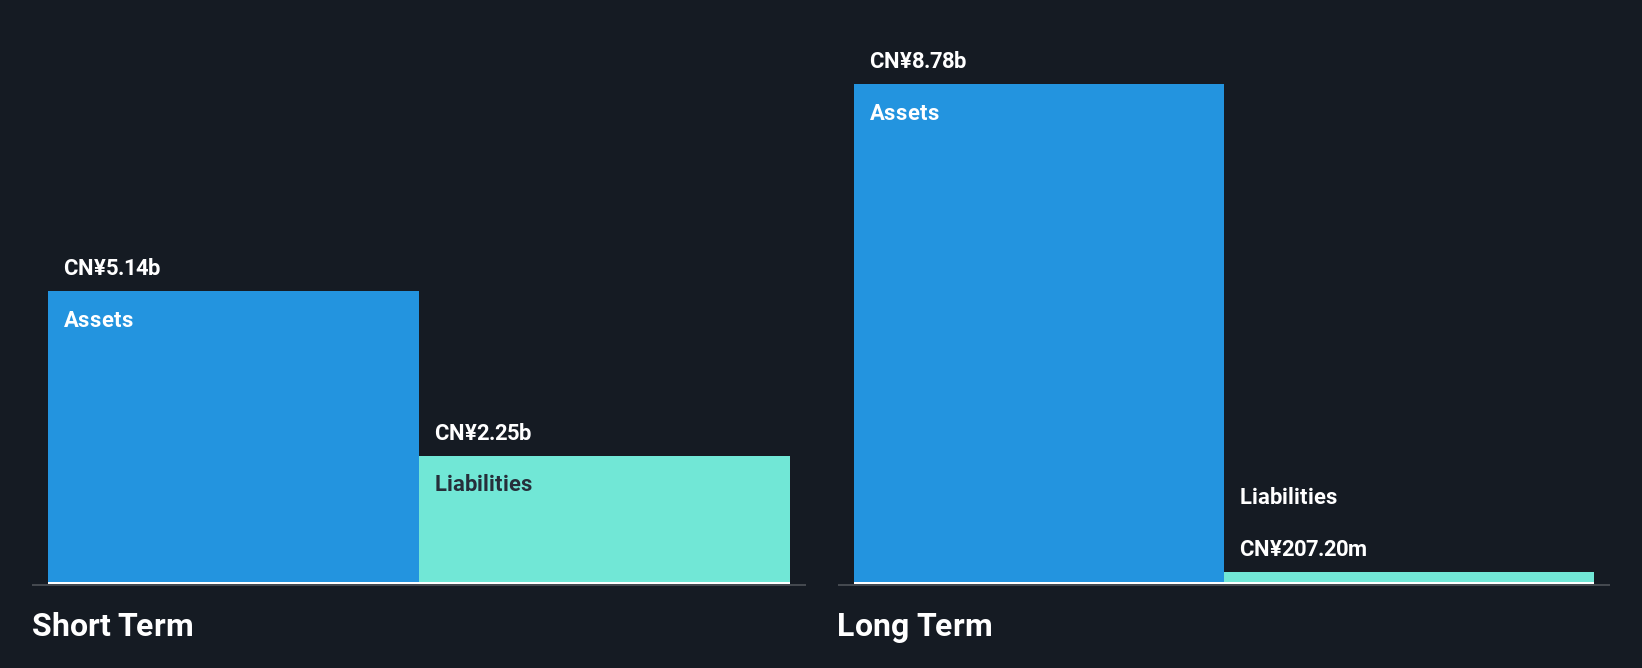
Overview: Shaanxi Beiyuan Chemical Industry Group Co., Ltd. operates in the chemical industry, focusing on the production and sale of various chemical products, with a market cap of CN¥17.64 billion.
Operations: No specific revenue segments are reported for the company.
Market Cap: CN¥17.64B
Shaanxi Beiyuan Chemical Industry Group, with a market cap of CN¥17.64 billion, reported declining sales and net income for the nine months ending September 2024, with earnings impacted by a significant one-off loss of CN¥491.7 million. The company remains debt-free, alleviating concerns over interest coverage and long-term liabilities as short-term assets significantly exceed both short- and long-term liabilities. However, its profit margins have decreased from 4.5% to 1.8%, and earnings have declined by an average of 20% annually over the past five years, indicating challenges in sustaining profitability despite an experienced management team.
- Dive into the specifics of Shaanxi Beiyuan Chemical Industry Group here with our thorough balance sheet health report.
- Explore historical data to track Shaanxi Beiyuan Chemical Industry Group's performance over time in our past results report.
Next Steps
- Gain an insight into the universe of 5,801 Penny Stocks by clicking here.
- Got skin in the game with these stocks? Elevate how you manage them by using Simply Wall St's portfolio, where intuitive tools await to help optimize your investment outcomes.
- Simply Wall St is your key to unlocking global market trends, a free user-friendly app for forward-thinking investors.
Interested In Other Possibilities?
- Explore high-performing small cap companies that haven't yet garnered significant analyst attention.
- Jump on the AI train with fast growing tech companies forging a new era of innovation.
- Find companies with promising cash flow potential yet trading below their fair value.
This article by Simply Wall St is general in nature. We provide commentary based on historical data and analyst forecasts only using an unbiased methodology and our articles are not intended to be financial advice. It does not constitute a recommendation to buy or sell any stock, and does not take account of your objectives, or your financial situation. We aim to bring you long-term focused analysis driven by fundamental data. Note that our analysis may not factor in the latest price-sensitive company announcements or qualitative material. Simply Wall St has no position in any stocks mentioned.
New: Manage All Your Stock Portfolios in One Place
We've created the ultimate portfolio companion for stock investors, and it's free.
• Connect an unlimited number of Portfolios and see your total in one currency• Be alerted to new Warning Signs or Risks via email or mobile• Track the Fair Value of your stocks
Try a Demo Portfolio for FreeHave feedback on this article? Concerned about the content? Get in touch with us directly. Alternatively, email editorial-team@simplywallst.com
免责声明:投资有风险,本文并非投资建议,以上内容不应被视为任何金融产品的购买或出售要约、建议或邀请,作者或其他用户的任何相关讨论、评论或帖子也不应被视为此类内容。本文仅供一般参考,不考虑您的个人投资目标、财务状况或需求。TTM对信息的准确性和完整性不承担任何责任或保证,投资者应自行研究并在投资前寻求专业建议。
热议股票
- 1
- 2
- 3
- 4
- 5
- 6
- 7
- 8
- 9
- 10