Discover 3 Compelling Penny Stocks With Market Caps Over US$100M
As global markets continue to experience broad-based gains, with U.S. indexes approaching record highs and smaller-cap indexes outperforming large-caps, the investment landscape remains dynamic and full of opportunities. Penny stocks, a term that may feel outdated yet still relevant, represent an intriguing area for investors seeking growth prospects in smaller or newer companies. By focusing on those with strong financial health and potential for stability, investors can uncover compelling opportunities within this niche market segment.
Top 10 Penny Stocks
| Name | Share Price | Market Cap | Financial Health Rating |
| BP Plastics Holding Bhd (KLSE:BPPLAS) | MYR1.21 | MYR340.59M | ★★★★★★ |
| DXN Holdings Bhd (KLSE:DXN) | MYR0.49 | MYR2.44B | ★★★★★★ |
| Lever Style (SEHK:1346) | HK$0.85 | HK$539.57M | ★★★★★★ |
| LaserBond (ASX:LBL) | A$0.58 | A$67.99M | ★★★★★★ |
| Hil Industries Berhad (KLSE:HIL) | MYR0.875 | MYR290.45M | ★★★★★★ |
| ME Group International (LSE:MEGP) | £2.21 | £832.65M | ★★★★★★ |
| Stelrad Group (LSE:SRAD) | £1.36 | £173.2M | ★★★★★☆ |
| Next 15 Group (AIM:NFG) | £4.21 | £418.71M | ★★★★☆☆ |
| Embark Early Education (ASX:EVO) | A$0.805 | A$147.7M | ★★★★☆☆ |
| Secure Trust Bank (LSE:STB) | £3.53 | £67.32M | ★★★★☆☆ |
Click here to see the full list of 5,783 stocks from our Penny Stocks screener.
We'll examine a selection from our screener results.
Marlin Global (NZSE:MLN)
Simply Wall St Financial Health Rating: ★★★★★★
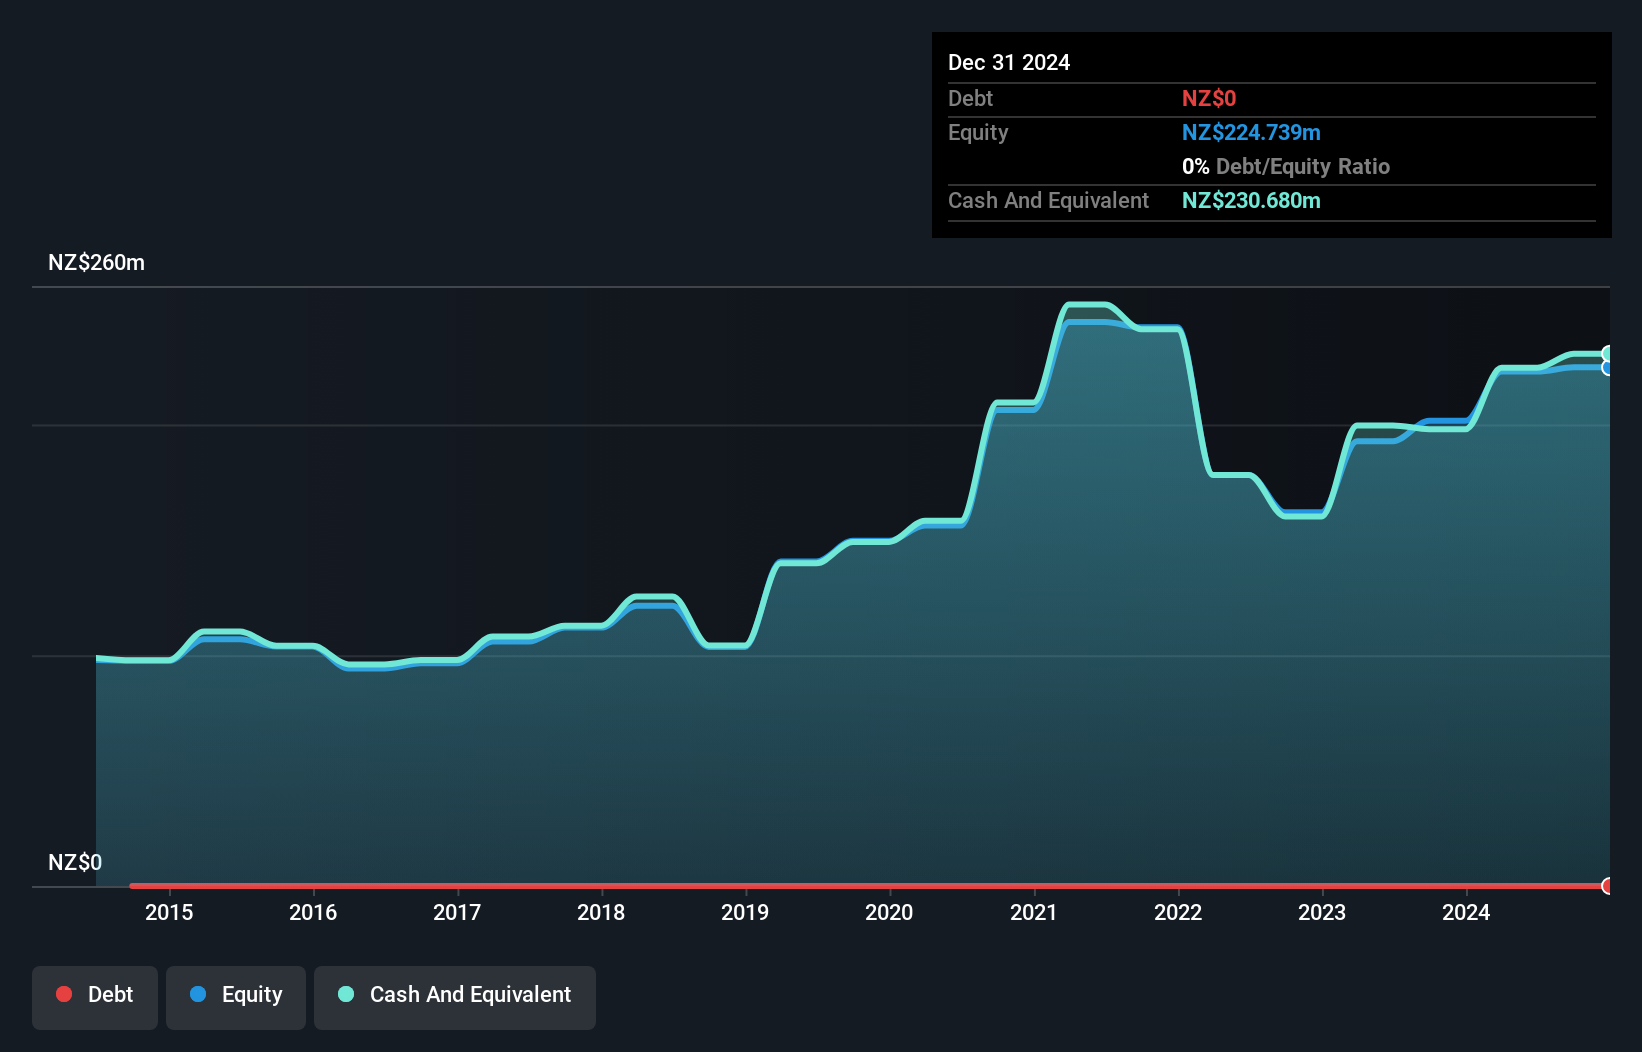
Overview: Marlin Global Limited is an investment company with a market cap of NZ$204.70 million.
Operations: The company generates revenue of NZ$42.79 million from its international financial investment segment.
Market Cap: NZ$204.7M
Marlin Global Limited, with a market cap of NZ$204.70 million, has demonstrated strong financial management by remaining debt-free and covering its short-term liabilities with assets totaling NZ$225.4 million against liabilities of NZ$2.5 million. Despite a low return on equity at 16.7%, the company experienced substantial earnings growth over the past year at 57.6%, outpacing industry averages and reversing a five-year decline trend of 10.8% annually. The recent share buyback reflects strategic capital management, although shareholder dilution occurred in the past year by 2.7%. Its dividend yield is high but not fully covered by free cash flows.
- Click here to discover the nuances of Marlin Global with our detailed analytical financial health report.
- Evaluate Marlin Global's historical performance by accessing our past performance report.
BIMobject (OM:BIM)
Simply Wall St Financial Health Rating: ★★★★★☆
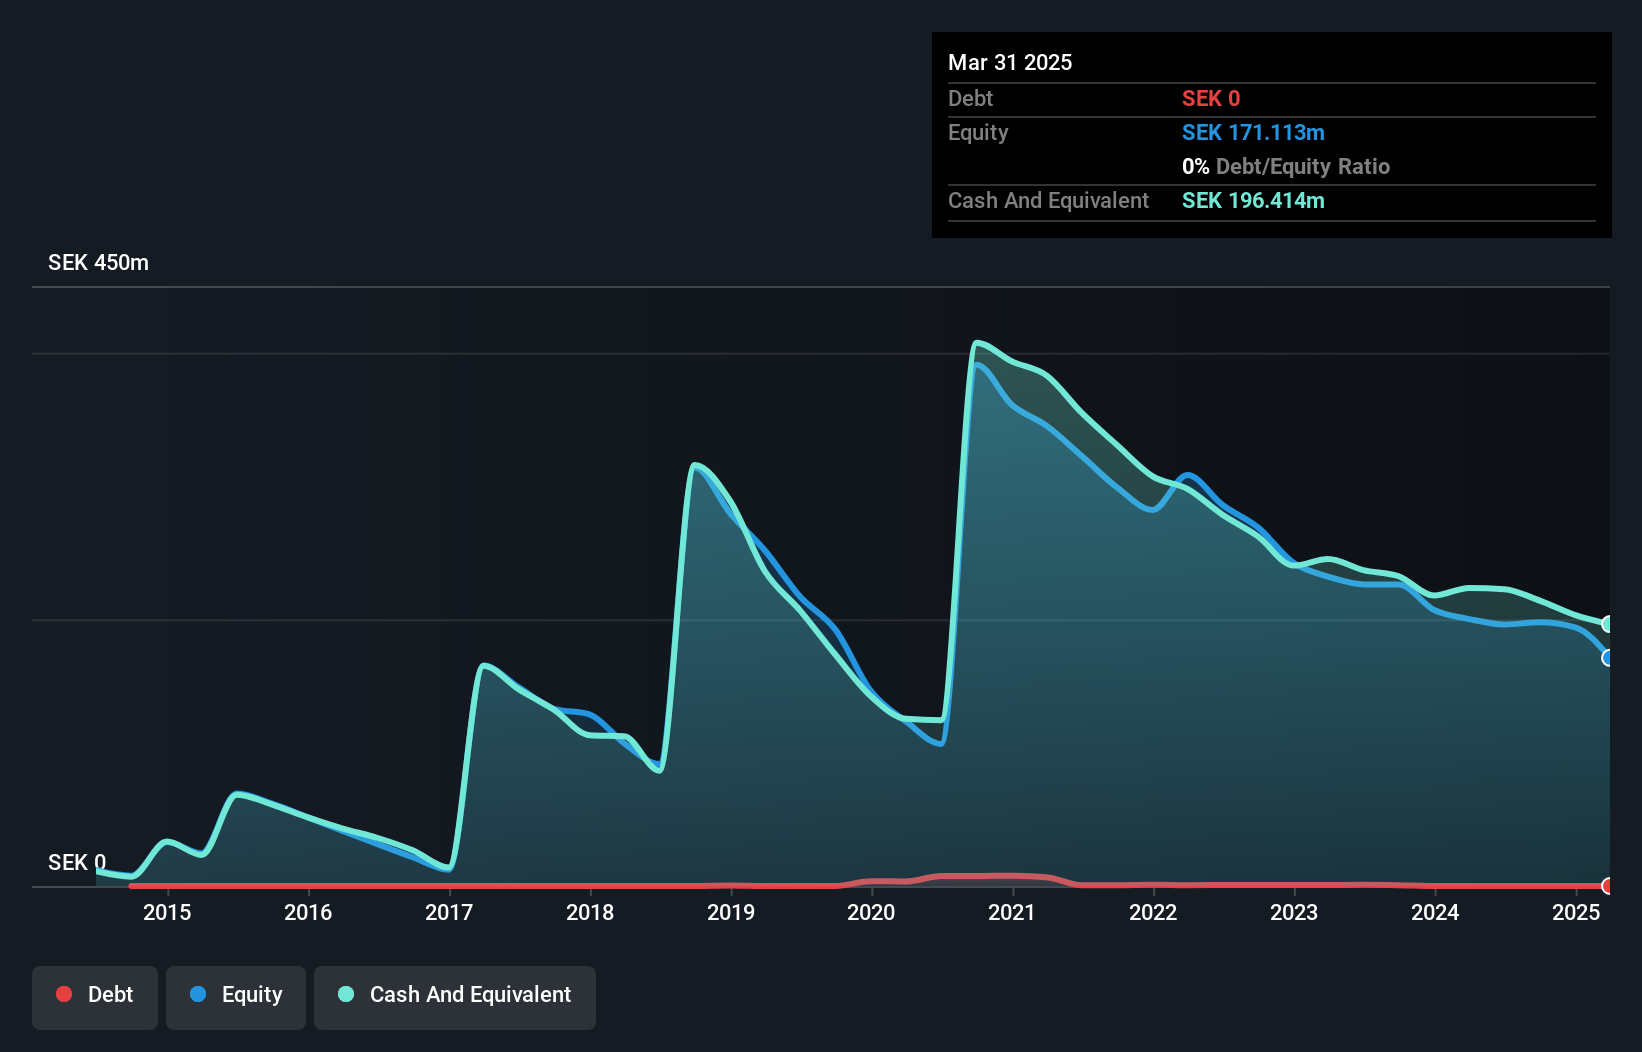
Overview: BIMobject AB is a software company that develops cloud solutions and services for building information modelling (BIM) globally, with a market cap of SEK648.84 million.
Operations: The company's revenue is primarily derived from its CAD/CAM Software segment, generating SEK169.40 million.
Market Cap: SEK648.84M
BIMobject AB, with a market cap of SEK648.84 million, shows potential in the software sector despite current unprofitability. Recent earnings reports indicate revenue growth to SEK43.21 million for Q3 2024 from SEK40.7 million a year prior, though net income decreased significantly to SEK0.161 million from SEK1.86 million. The company benefits from strong financial positioning, with short-term assets of SEK245.6M surpassing both long and short-term liabilities and maintaining more cash than debt. However, challenges include an inexperienced board and management team alongside negative return on equity at -9.89%. Despite these hurdles, BIMobject's cash runway extends beyond three years without significant shareholder dilution recently observed.
- Click to explore a detailed breakdown of our findings in BIMobject's financial health report.
- Assess BIMobject's previous results with our detailed historical performance reports.
Maike Tube Industry Holdings (SEHK:1553)
Simply Wall St Financial Health Rating: ★★★★★☆
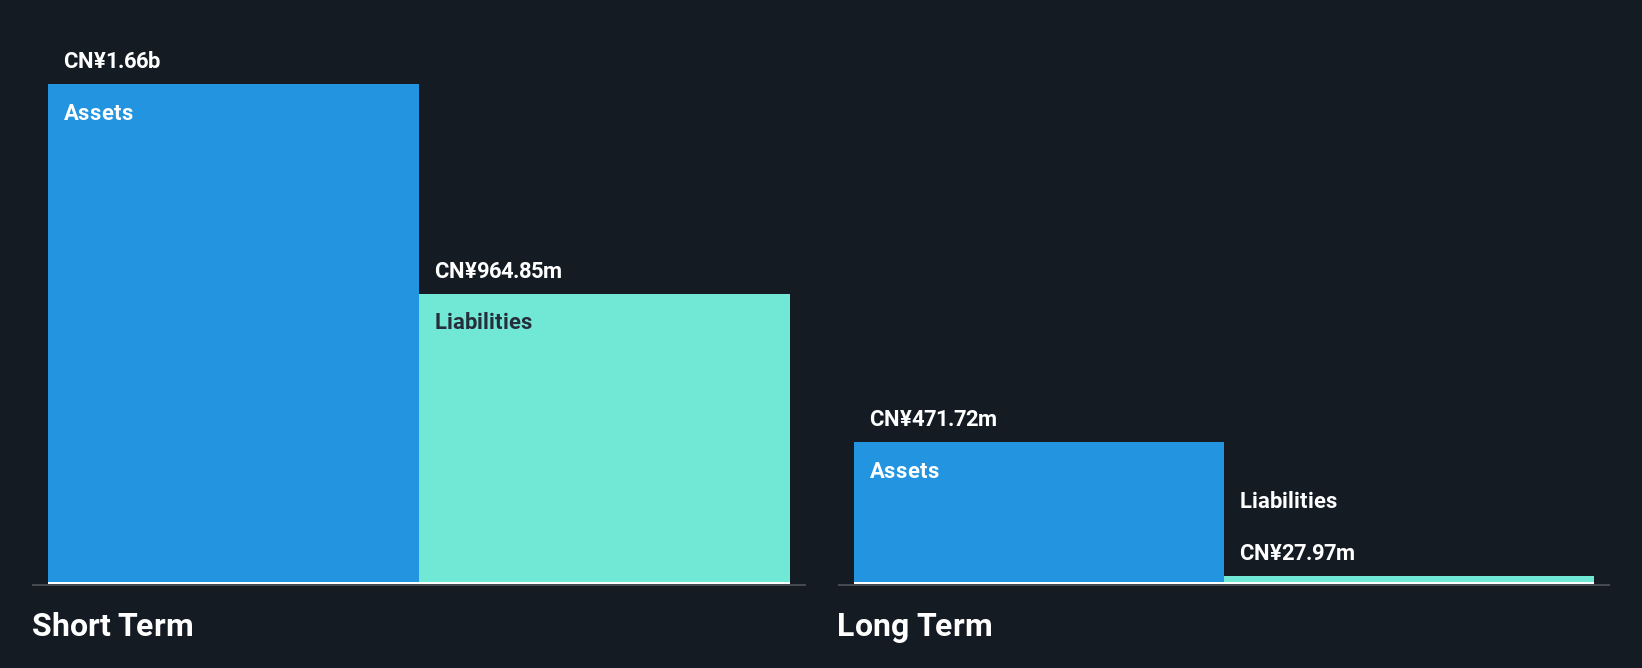
Overview: Maike Tube Industry Holdings Limited is an investment holding company that manufactures and sells steel pipe products and prefabricated pipe nipple products across China, Asia, the United States, Europe, and internationally, with a market cap of HK$659.38 million.
Operations: The company generates CN¥2.28 billion in revenue from its production and sales of pipe products.
Market Cap: HK$659.38M
Maike Tube Industry Holdings Limited, with a market cap of HK$659.38 million, demonstrates financial stability with short-term assets of CN¥1.4 billion exceeding both short and long-term liabilities. The company reported revenue growth to CN¥1.16 billion for the first half of 2024, up from CN¥1.07 billion the previous year, alongside net income rising to CN¥81.55 million from CN¥72.28 million. While its Return on Equity is low at 15.1%, Maike Tube benefits from reduced debt levels and stable earnings growth over five years at 14.7% annually, though operating cash flow remains negative impacting debt coverage by cash flow metrics.
- Jump into the full analysis health report here for a deeper understanding of Maike Tube Industry Holdings.
- Explore historical data to track Maike Tube Industry Holdings' performance over time in our past results report.
Where To Now?
- Embark on your investment journey to our 5,783 Penny Stocks selection here.
- Are any of these part of your asset mix? Tap into the analytical power of Simply Wall St's portfolio to get a 360-degree view on how they're shaping up.
- Take control of your financial future using Simply Wall St, offering free, in-depth knowledge of international markets to every investor.
Looking For Alternative Opportunities?
- Explore high-performing small cap companies that haven't yet garnered significant analyst attention.
- Jump on the AI train with fast growing tech companies forging a new era of innovation.
- Find companies with promising cash flow potential yet trading below their fair value.
This article by Simply Wall St is general in nature. We provide commentary based on historical data and analyst forecasts only using an unbiased methodology and our articles are not intended to be financial advice. It does not constitute a recommendation to buy or sell any stock, and does not take account of your objectives, or your financial situation. We aim to bring you long-term focused analysis driven by fundamental data. Note that our analysis may not factor in the latest price-sensitive company announcements or qualitative material. Simply Wall St has no position in any stocks mentioned.
New: Manage All Your Stock Portfolios in One Place
We've created the ultimate portfolio companion for stock investors, and it's free.
• Connect an unlimited number of Portfolios and see your total in one currency• Be alerted to new Warning Signs or Risks via email or mobile• Track the Fair Value of your stocks
Try a Demo Portfolio for FreeHave feedback on this article? Concerned about the content? Get in touch with us directly. Alternatively, email editorial-team@simplywallst.com
免责声明:投资有风险,本文并非投资建议,以上内容不应被视为任何金融产品的购买或出售要约、建议或邀请,作者或其他用户的任何相关讨论、评论或帖子也不应被视为此类内容。本文仅供一般参考,不考虑您的个人投资目标、财务状况或需求。TTM对信息的准确性和完整性不承担任何责任或保证,投资者应自行研究并在投资前寻求专业建议。
热议股票
- 1
- 2
- 3
- 4
- 5
- 6
- 7
- 8
- 9
- 10