Jacobs Solutions Inc. (NYSE:J) Stock Has Shown Weakness Lately But Financials Look Strong: Should Prospective Shareholders Make The Leap?
With its stock down 4.9% over the past three months, it is easy to disregard Jacobs Solutions (NYSE:J). But if you pay close attention, you might gather that its strong financials could mean that the stock could potentially see an increase in value in the long-term, given how markets usually reward companies with good financial health. Specifically, we decided to study Jacobs Solutions' ROE in this article.
Return on equity or ROE is a key measure used to assess how efficiently a company's management is utilizing the company's capital. Put another way, it reveals the company's success at turning shareholder investments into profits.
Check out our latest analysis for Jacobs Solutions
How Is ROE Calculated?
The formula for ROE is:
Return on Equity = Net Profit (from continuing operations) ÷ Shareholders' Equity
So, based on the above formula, the ROE for Jacobs Solutions is:
12% = US$646m ÷ US$5.4b (Based on the trailing twelve months to September 2024).
The 'return' is the income the business earned over the last year. That means that for every $1 worth of shareholders' equity, the company generated $0.12 in profit.
What Is The Relationship Between ROE And Earnings Growth?
We have already established that ROE serves as an efficient profit-generating gauge for a company's future earnings. Depending on how much of these profits the company reinvests or "retains", and how effectively it does so, we are then able to assess a company’s earnings growth potential. Assuming all else is equal, companies that have both a higher return on equity and higher profit retention are usually the ones that have a higher growth rate when compared to companies that don't have the same features.
Jacobs Solutions' Earnings Growth And 12% ROE
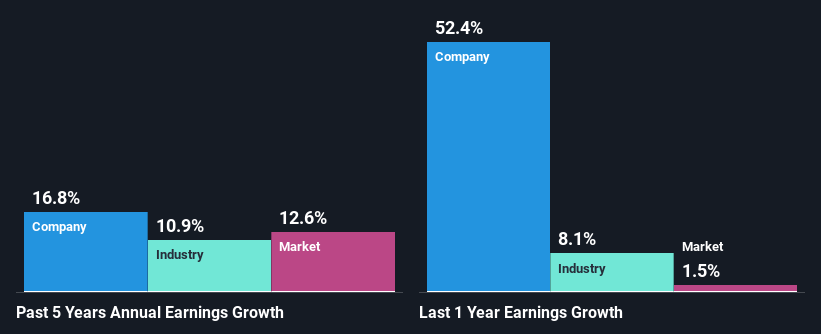
To begin with, Jacobs Solutions seems to have a respectable ROE. Be that as it may, the company's ROE is still quite lower than the industry average of 20%. However, the moderate 17% net income growth seen by Jacobs Solutions over the past five years is definitely a positive. Therefore, the growth in earnings could probably have been caused by other variables. For instance, the company has a low payout ratio or is being managed efficiently. However, not to forget, the company does have a decent ROE to begin with, just that it is lower than the industry average. So this also does lend some color to the fairly high earnings growth seen by the company.
We then compared Jacobs Solutions' net income growth with the industry and we're pleased to see that the company's growth figure is higher when compared with the industry which has a growth rate of 11% in the same 5-year period.
The basis for attaching value to a company is, to a great extent, tied to its earnings growth. What investors need to determine next is if the expected earnings growth, or the lack of it, is already built into the share price. Doing so will help them establish if the stock's future looks promising or ominous. Is J fairly valued? This infographic on the company's intrinsic value has everything you need to know.
Is Jacobs Solutions Using Its Retained Earnings Effectively?
Jacobs Solutions has a low three-year median payout ratio of 24%, meaning that the company retains the remaining 76% of its profits. This suggests that the management is reinvesting most of the profits to grow the business.
Moreover, Jacobs Solutions is determined to keep sharing its profits with shareholders which we infer from its long history of eight years of paying a dividend. Upon studying the latest analysts' consensus data, we found that the company's future payout ratio is expected to drop to 19% over the next three years. Accordingly, the expected drop in the payout ratio explains the expected increase in the company's ROE to 17%, over the same period.
Conclusion
Overall, we are quite pleased with Jacobs Solutions' performance. In particular, it's great to see that the company has seen significant growth in its earnings backed by a respectable ROE and a high reinvestment rate. Having said that, the company's earnings growth is expected to slow down, as forecasted in the current analyst estimates. To know more about the latest analysts predictions for the company, check out this visualization of analyst forecasts for the company.
New: Manage All Your Stock Portfolios in One Place
We've created the ultimate portfolio companion for stock investors, and it's free.
• Connect an unlimited number of Portfolios and see your total in one currency• Be alerted to new Warning Signs or Risks via email or mobile• Track the Fair Value of your stocks
Try a Demo Portfolio for FreeHave feedback on this article? Concerned about the content? Get in touch with us directly. Alternatively, email editorial-team (at) simplywallst.com.This article by Simply Wall St is general in nature. We provide commentary based on historical data and analyst forecasts only using an unbiased methodology and our articles are not intended to be financial advice. It does not constitute a recommendation to buy or sell any stock, and does not take account of your objectives, or your financial situation. We aim to bring you long-term focused analysis driven by fundamental data. Note that our analysis may not factor in the latest price-sensitive company announcements or qualitative material. Simply Wall St has no position in any stocks mentioned.
免责声明:投资有风险,本文并非投资建议,以上内容不应被视为任何金融产品的购买或出售要约、建议或邀请,作者或其他用户的任何相关讨论、评论或帖子也不应被视为此类内容。本文仅供一般参考,不考虑您的个人投资目标、财务状况或需求。TTM对信息的准确性和完整性不承担任何责任或保证,投资者应自行研究并在投资前寻求专业建议。
热议股票
- 1
- 2
- 3
- 4
- 5
- 6
- 7
- 8
- 9
- 10