Aptos (APT) Price Recovers 15% After $2 Billion Market Cap Loss
- APT gains 15%, rebounding after market cap drop and token unlock concerns, signaling reversal.
- Indicators like DMI and Ichimoku Cloud suggest bullish momentum, with targets near $15 if support at $13.38 holds.
- Failure to sustain momentum could lead to another decline, testing support near $12.3 or lower.
Aptos (APT) price has risen nearly 15% in the last 24 hours, recovering strongly after its market cap dropped by $2 billion ahead of a $134 million token unlock. Despite recent bearish signals, such as a death cross formation and a 10% price decrease, APT is showing signs of a potential trend reversal.
Indicators like the Ichimoku Cloud and EMA lines suggest bullish momentum could push APT to test levels near $15 if the uptrend continues. However, key support at $13.38 remains critical; a break below this level could lead to a deeper correction.
Aptos Uptrend Is Surpassing Downtrend Indicators
Aptos DMI chart shows its ADX at 32.96, down from 42 yesterday, indicating a weakening in trend strength. This decline follows a strong correction, suggesting that the prior trend is losing momentum.
Despite the drop in ADX, the metric remains above the threshold of 25, which indicates the trend is still moderately strong, albeit less dominant than before.
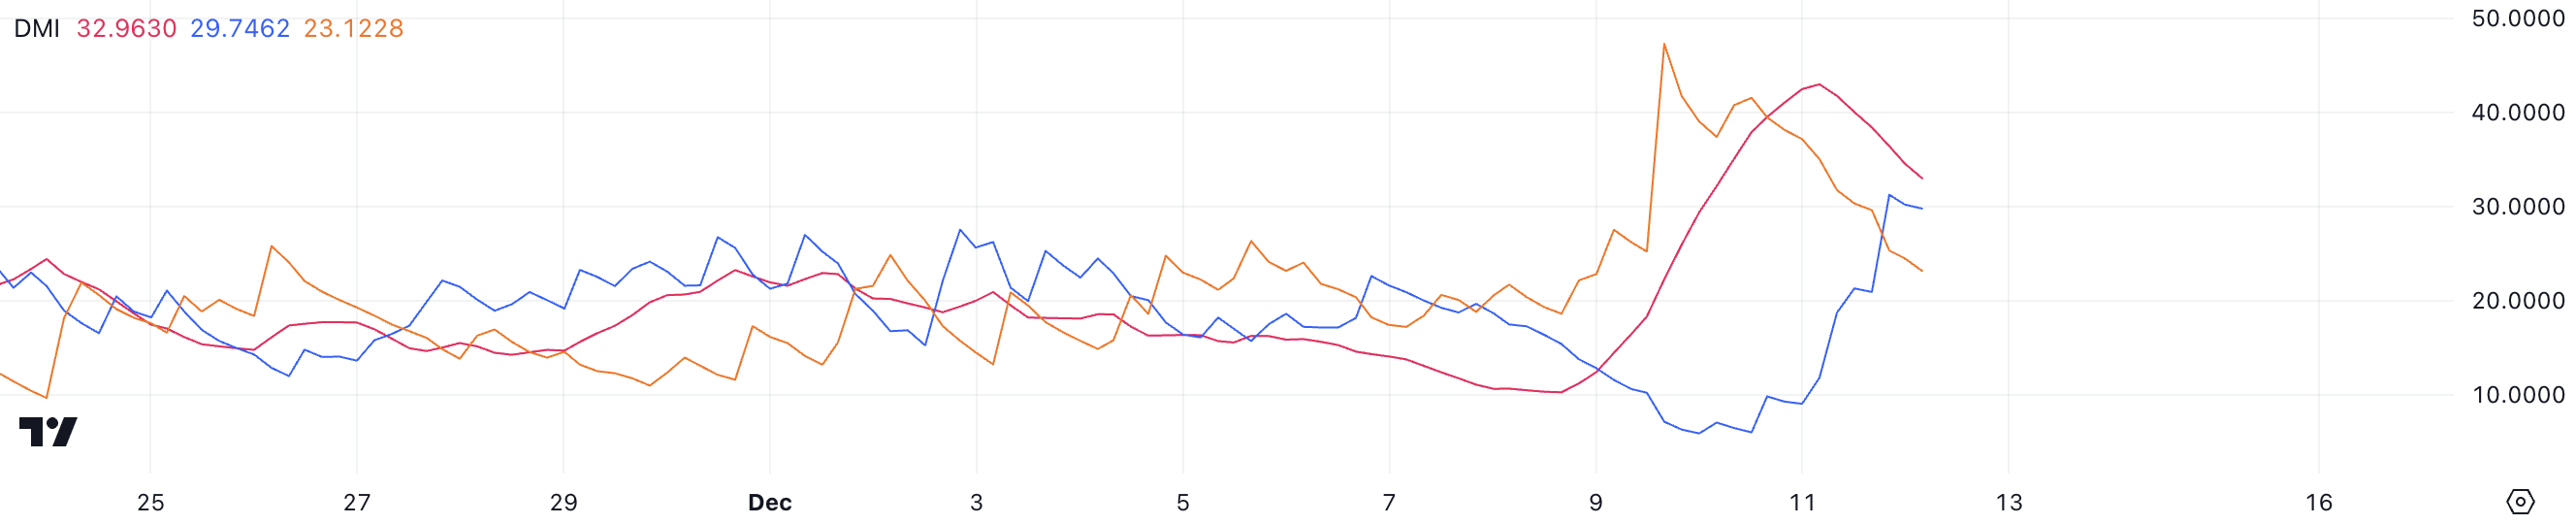
ADX, or Average Directional Index, measures the strength of a trend, regardless of direction. Values below 20 suggest a weak or non-existent trend, while readings above 25 indicate a stronger trend.
Following the last few days correction, D+ has crossed above D-, with D+ currently at 29.7 and D- at 23.1. This crossover signals a potential shift toward bullish momentum, suggesting APT could see a short-term recovery if buying pressure sustains.
APT Ichimoku Cloud Shows a Strong Upside
This Ichimoku Cloud chart for Aptos shows that the price is trading slightly above the cloud, which suggests a bullish bias. The green cloud ahead indicates potential support, while the relatively flat top of the cloud signals that resistance near $14 might be significant.
The Tenkan-sen (blue line) and Kijun-sen (red line) are converging, suggesting a consolidation phase or a potential slowdown in bullish momentum.
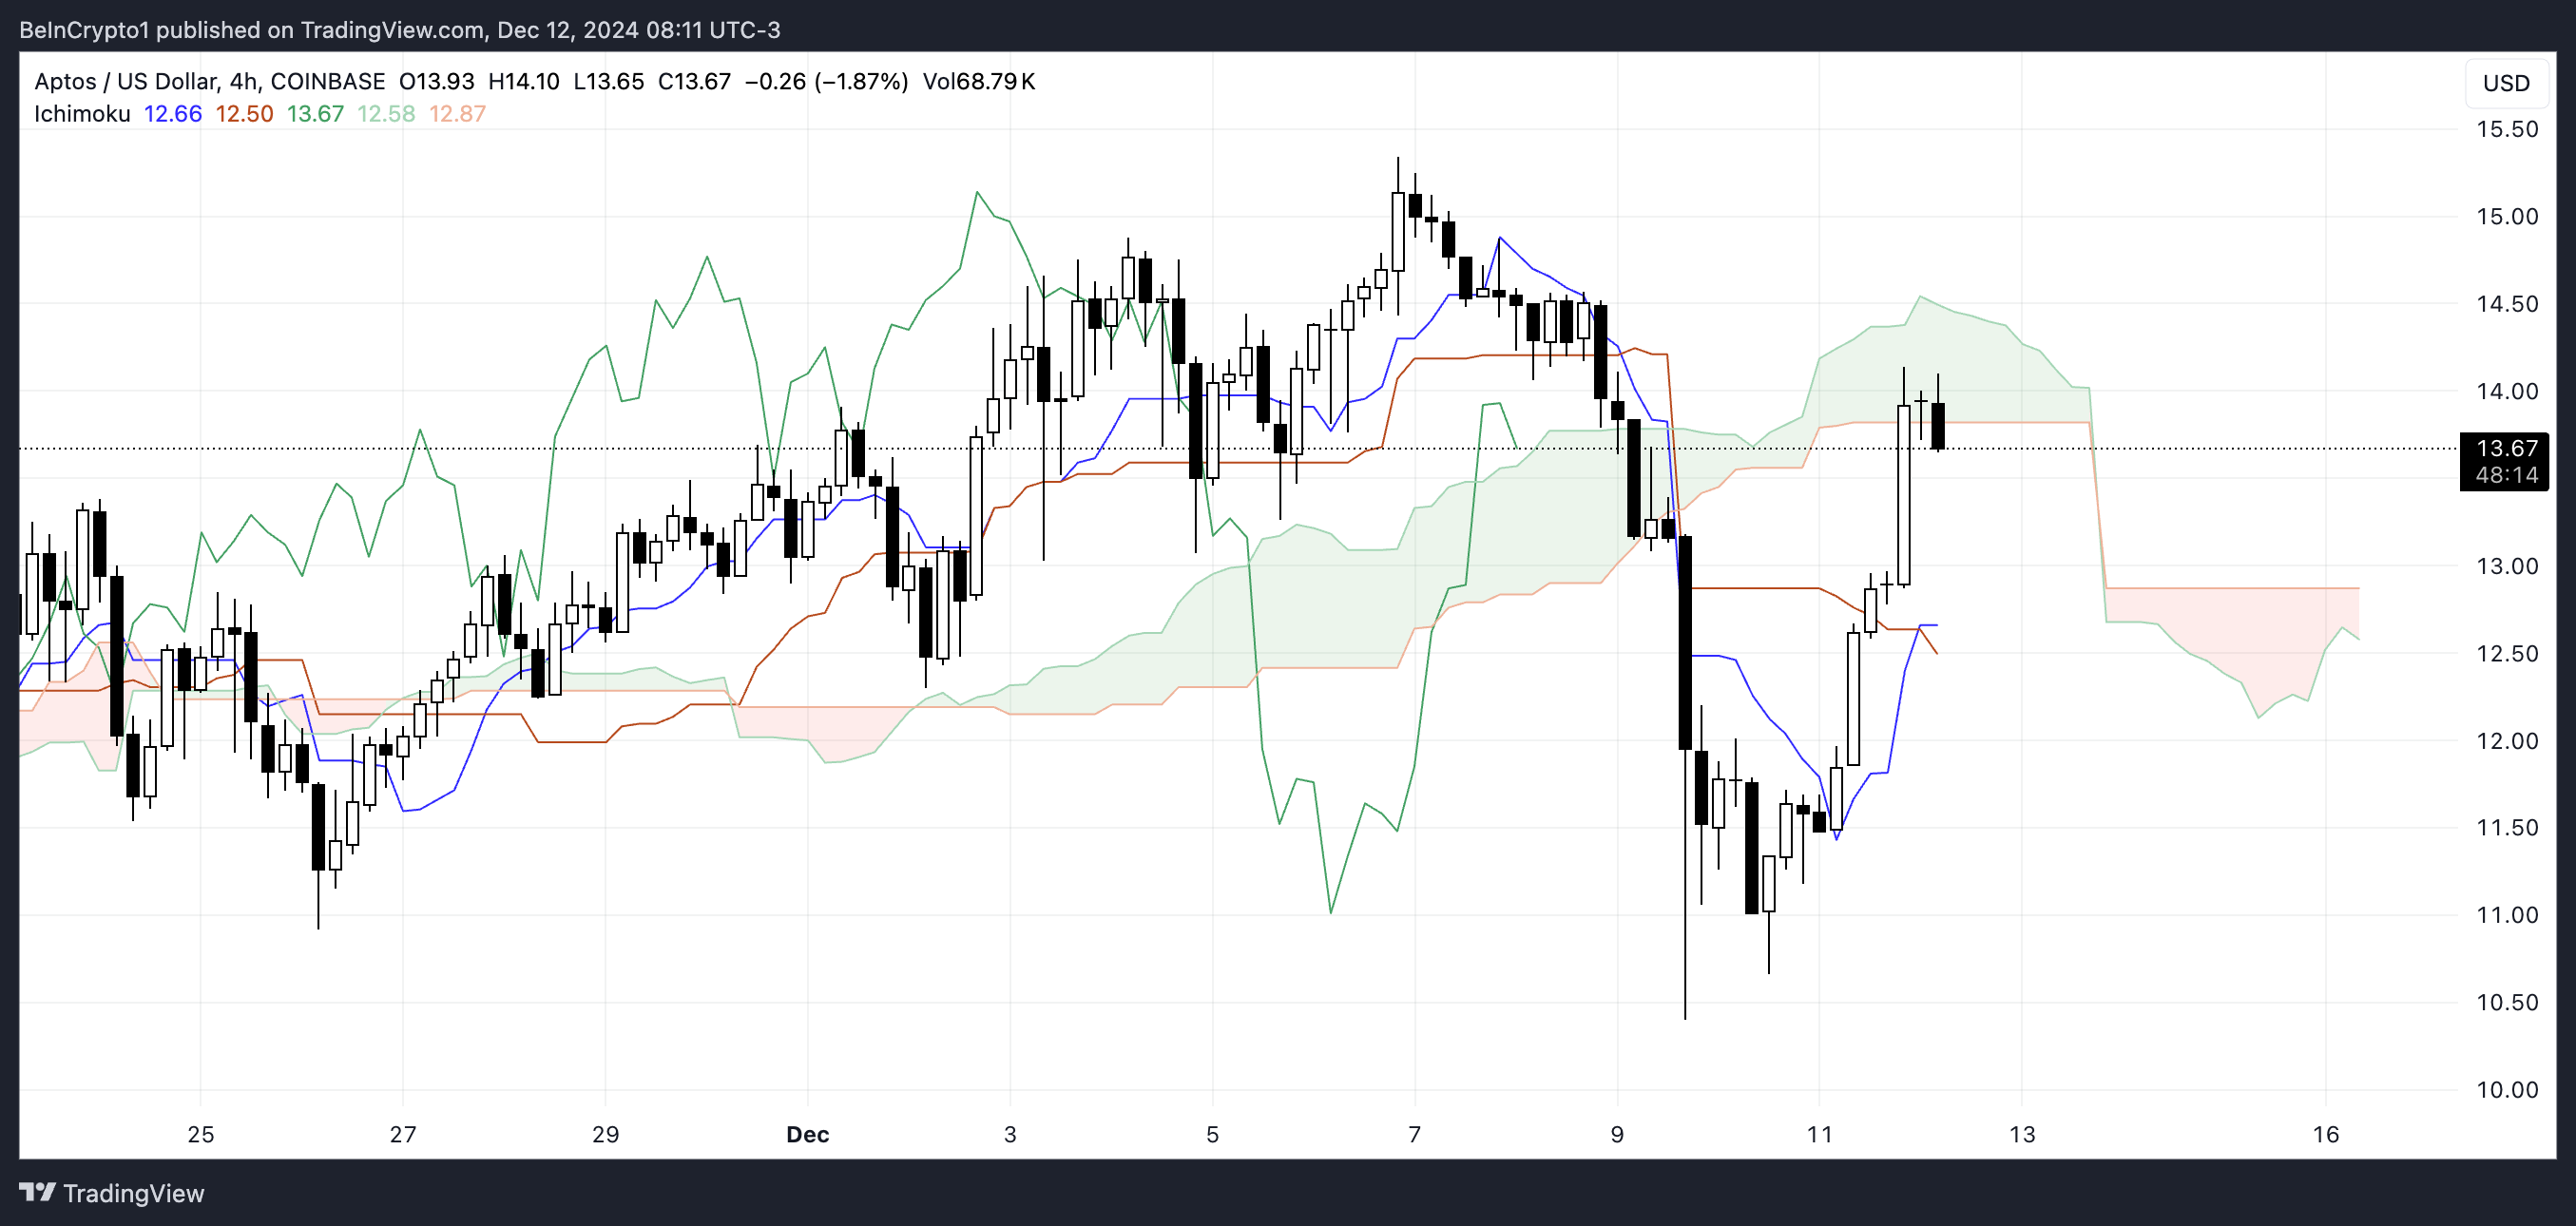
If the price manages to stay above the cloud and the Tenkan-sen crosses above the Kijun-sen again, it could signal renewed bullish momentum with potential upward targets near $14.5 or beyond.
However, if APT price dips back into the cloud, it could indicate indecision, with support levels near $12.5 coming into play. A break below the cloud would shift the bias to bearish, opening the door for a retest of lower levels.
Aptos Price Prediction: Back to $15 Soon?
APT’s EMA lines present an intriguing setup. On December 9, they formed a death cross, with the short-term EMA crossing below a longer-term EMA, signaling a bearish trend.
This was followed by a price drop of over 10%, aligning with the crossover’s bearish implications. The death cross showed the selling pressure, which briefly dominated Aptos price action.
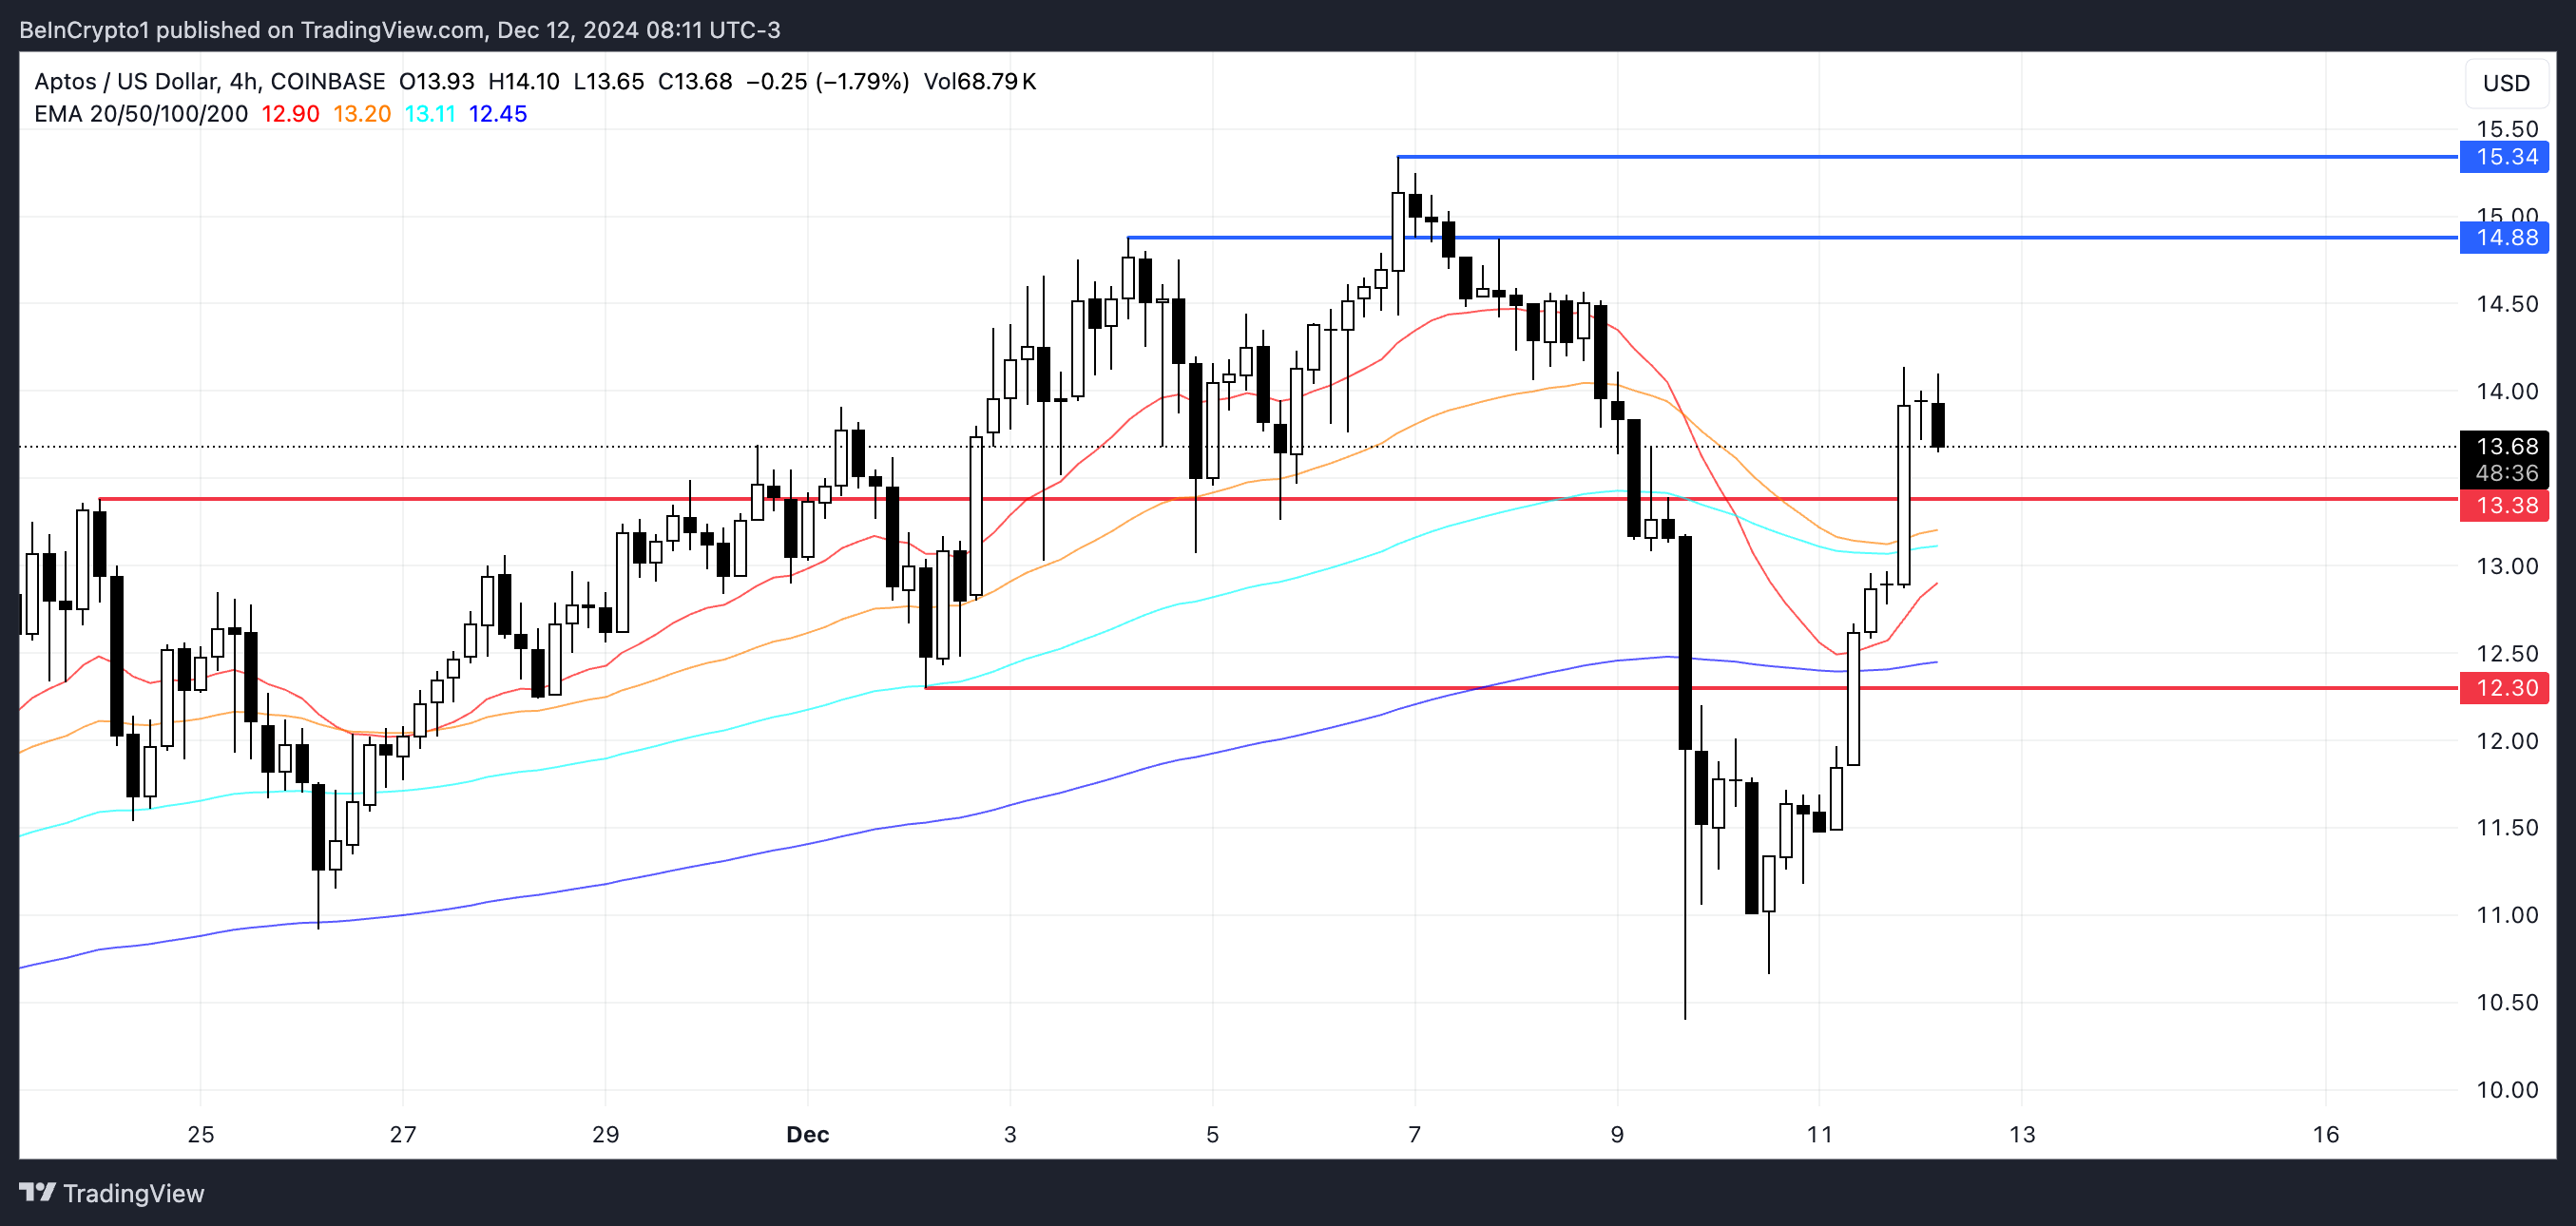
However, Aptos has since begun recovering, and the shortest-term EMA is now close to crossing back above other EMA lines, potentially forming a bullish crossover. If this occurs, it could ignite a strong upward move, with price targets at $14.88 or even $15.34.
Conversely, if APT price fails to sustain its current momentum and loses support at $13.38, it could face another downturn, potentially falling to $12.3.
免责声明:投资有风险,本文并非投资建议,以上内容不应被视为任何金融产品的购买或出售要约、建议或邀请,作者或其他用户的任何相关讨论、评论或帖子也不应被视为此类内容。本文仅供一般参考,不考虑您的个人投资目标、财务状况或需求。TTM对信息的准确性和完整性不承担任何责任或保证,投资者应自行研究并在投资前寻求专业建议。
热议股票
- 1
- 2
- 3
- 4
- 5
- 6
- 7
- 8
- 9
- 10