Ethereum (ETH) Price Closes Above $3,900 — Is a New All-Time High Possible Before 2024 Ends?
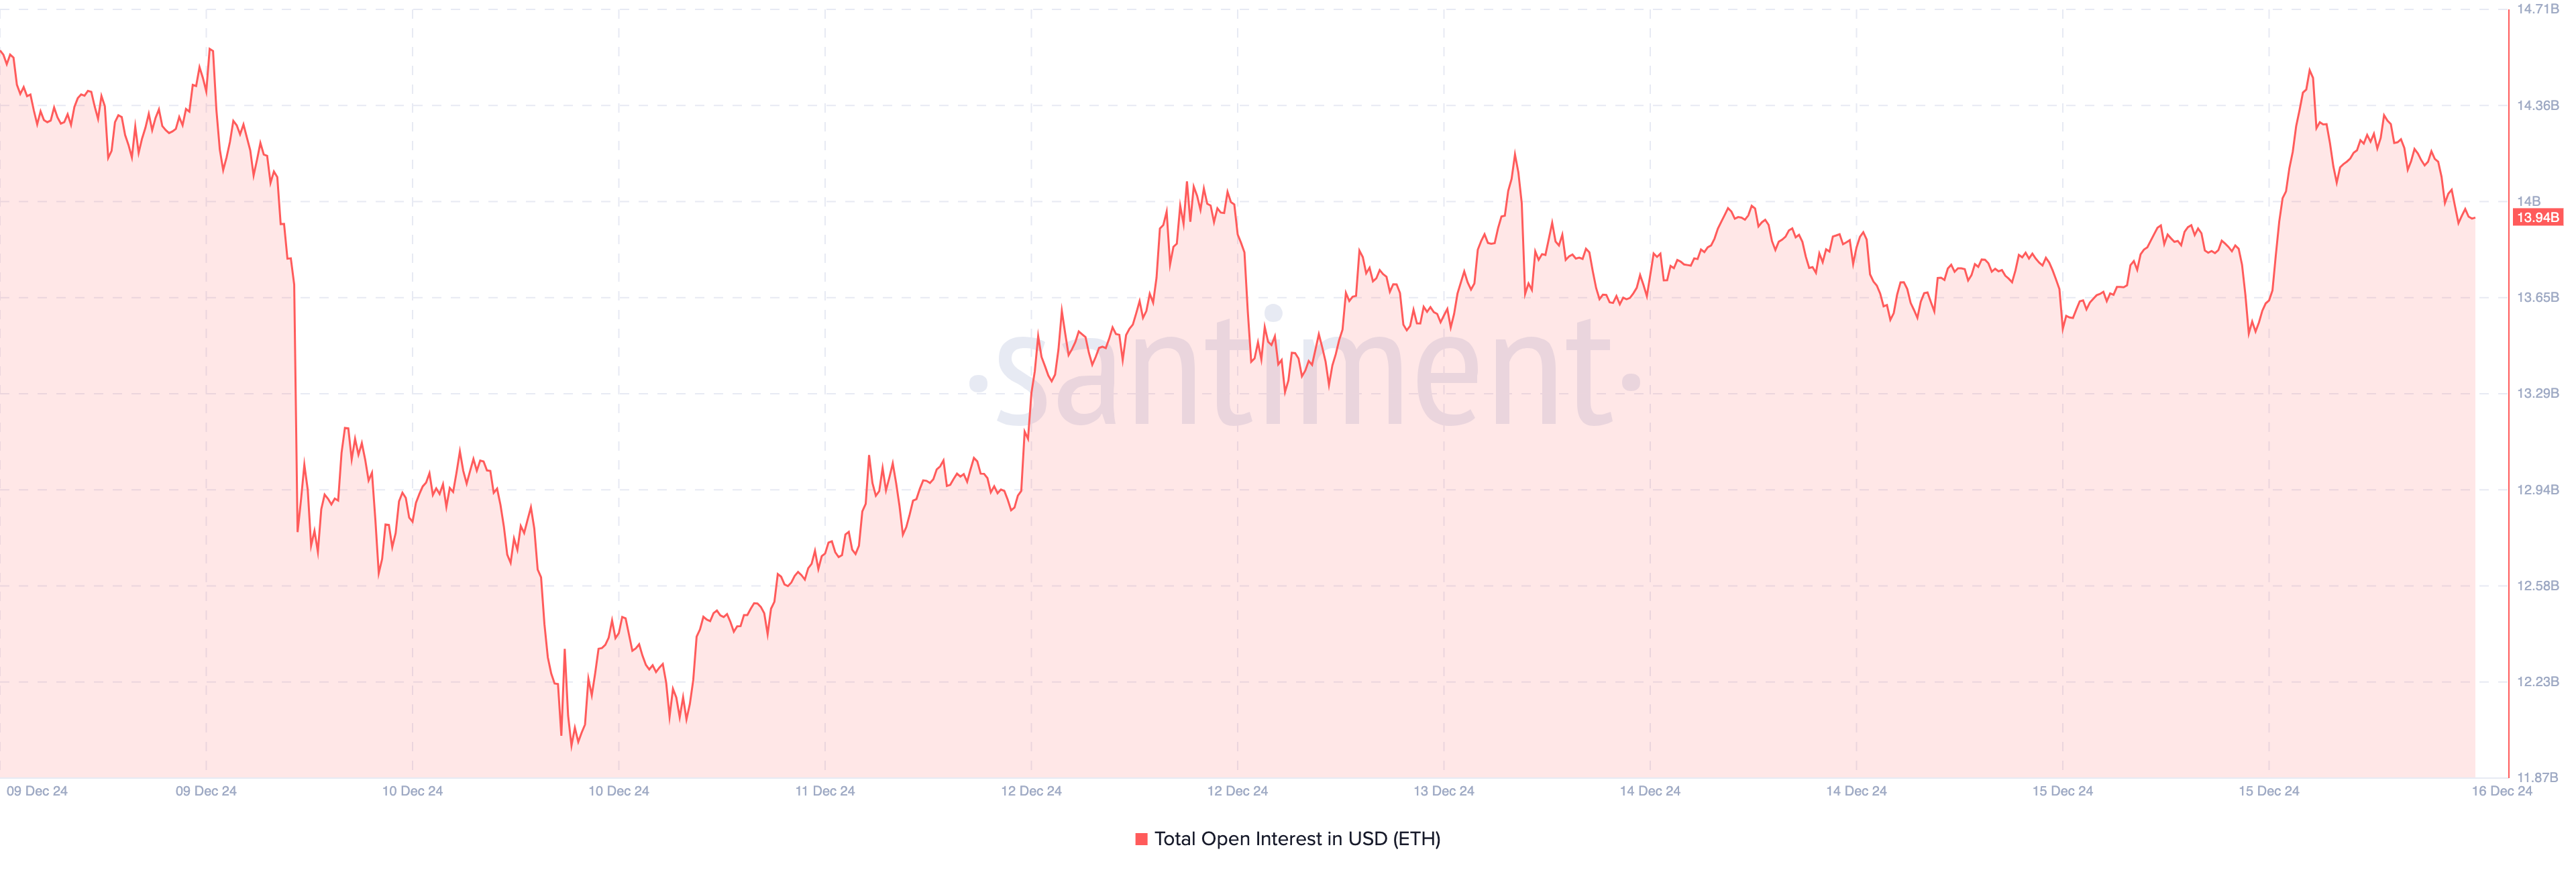
- Ethereum’s Open Interest fell from $14.50B to $13.94 billion, indicating reduced market exposure and potential bearish pressure.
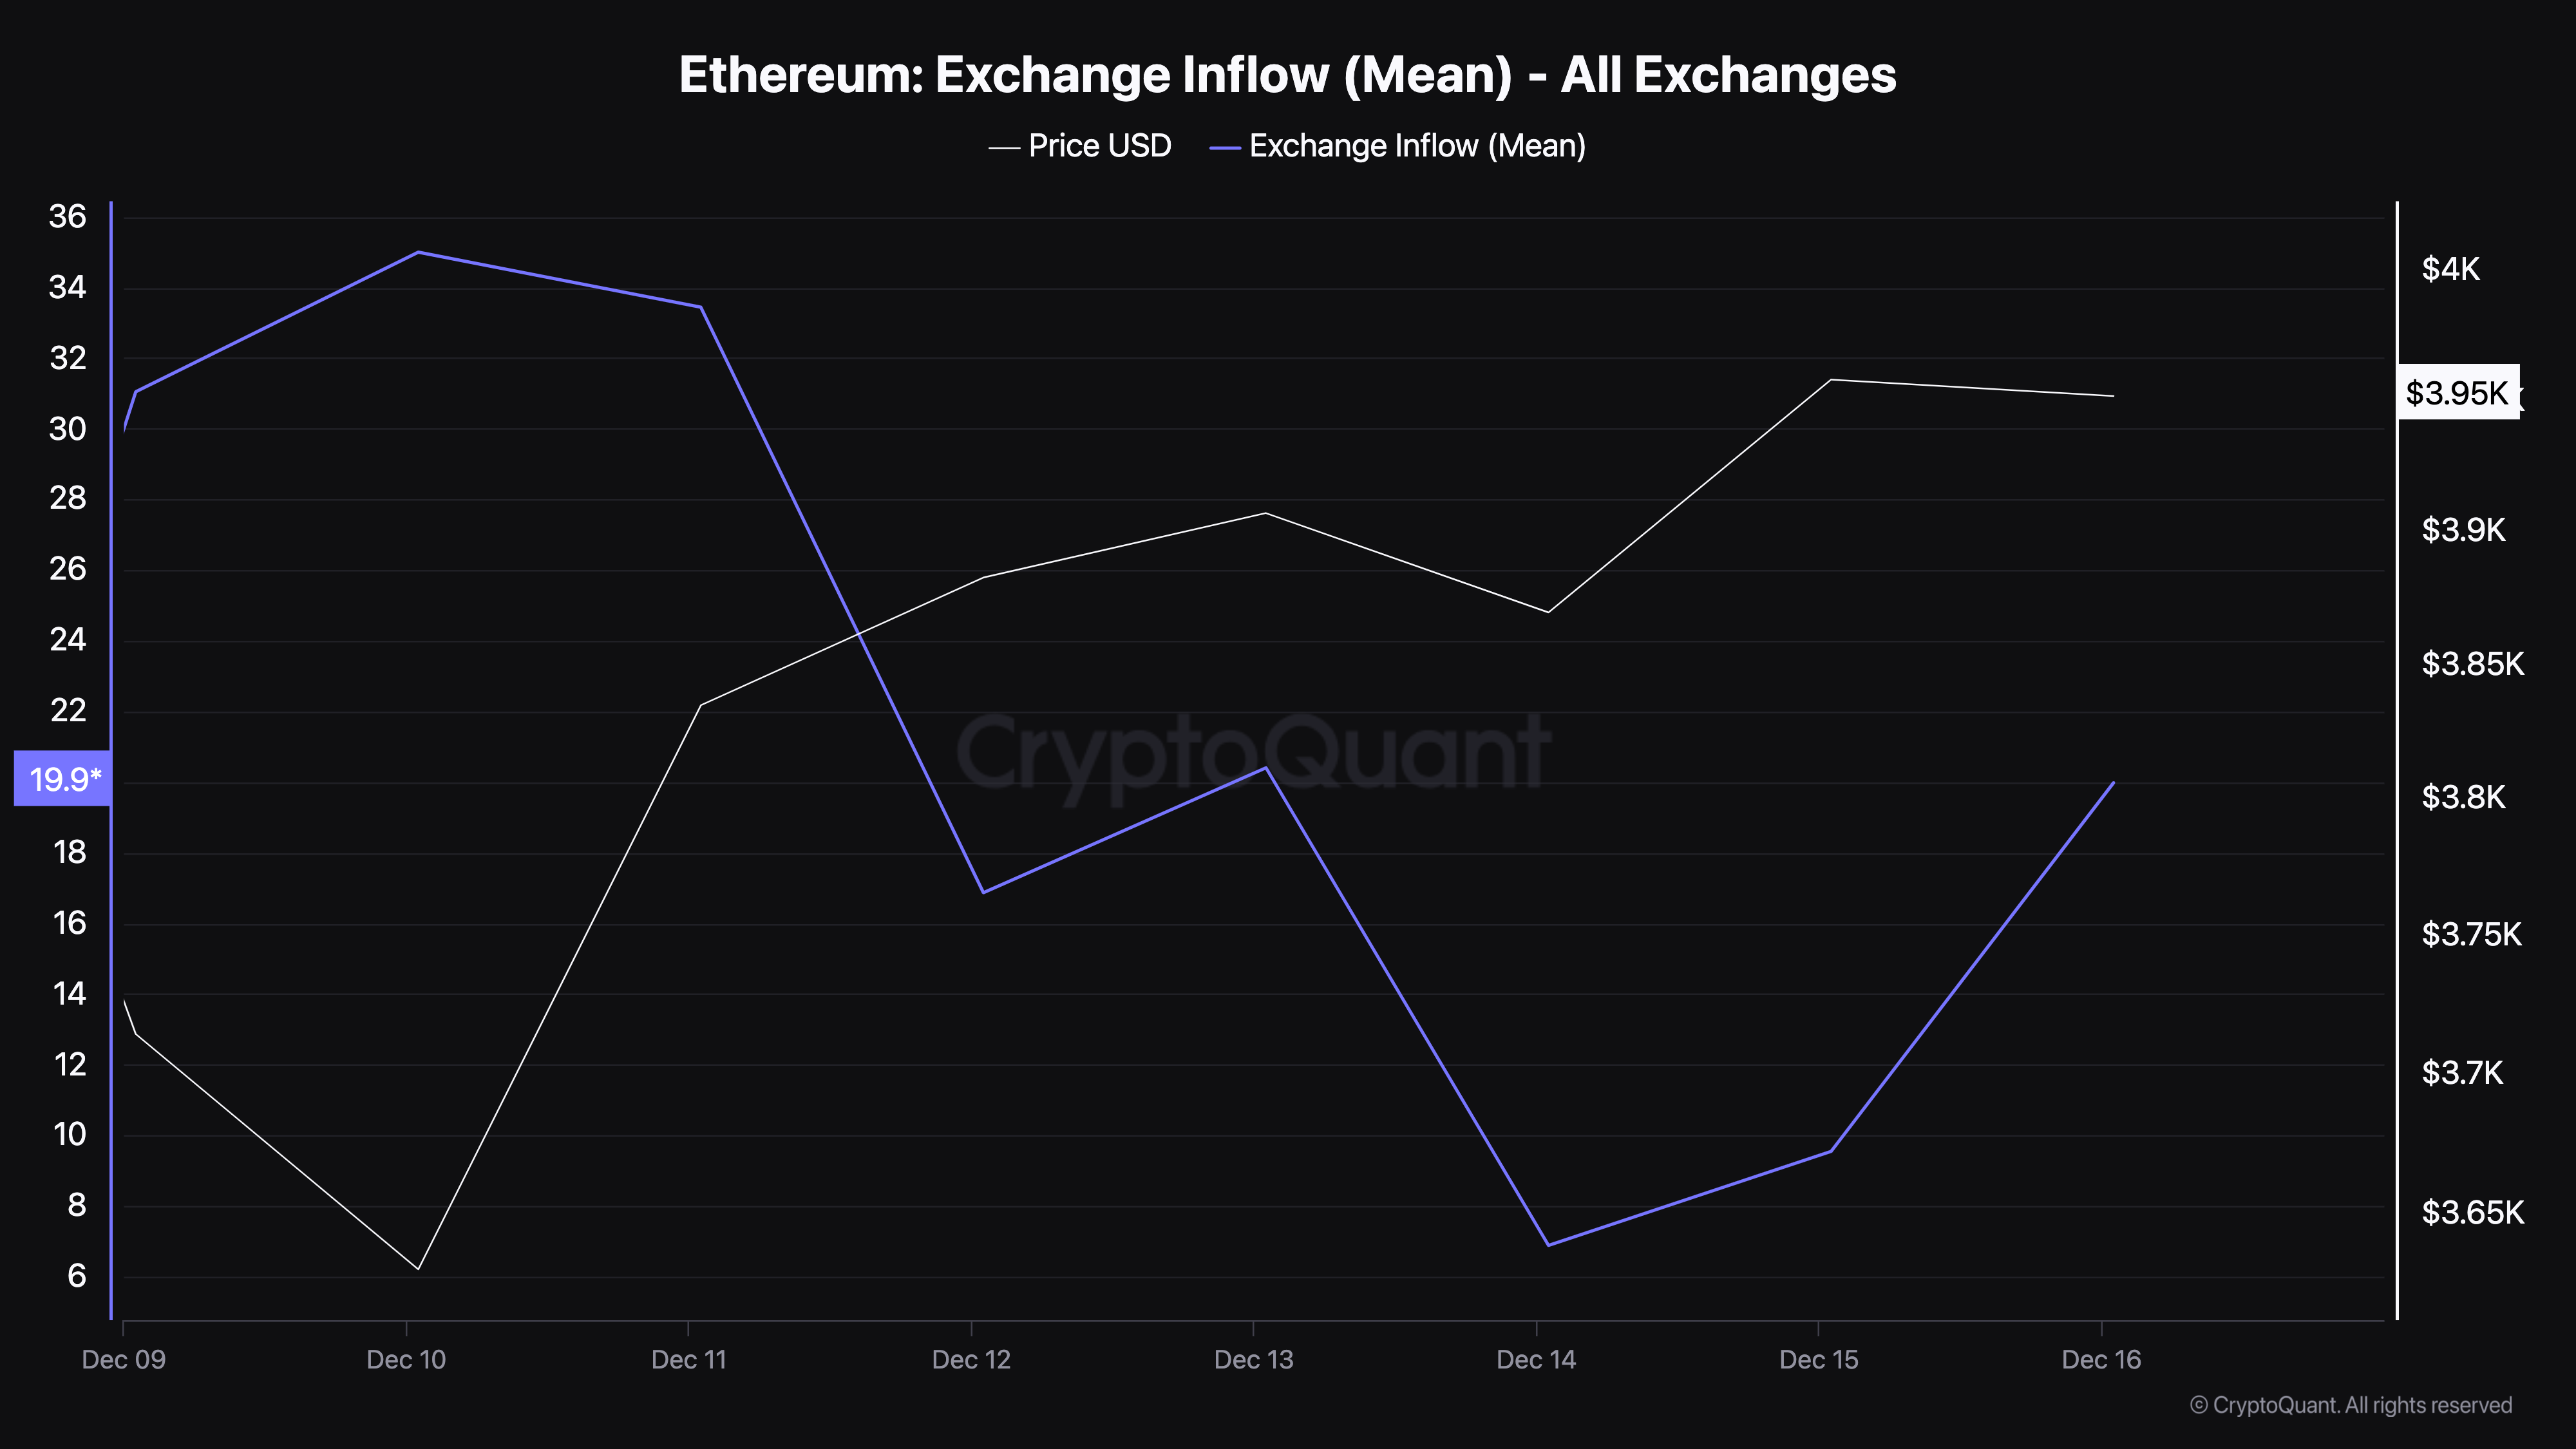
- Increased inflows to exchanges suggest higher selling pressure, which could cap the cryptocurrency's near-term price growth.
- ETH may fall to $3,315 unless buying pressure rebounds. A rally toward $4,500 or a new ATH hinges on stronger OI recovery.
Once again, the price of Ethereum (ETH) has risen above $3,900. This bounce has hinted at a further price increase for the altcoin before the end of the year.
But does this mean the cryptocurrency can surpass its previous all-time high within this short period? This on-chain analysis reveals whether that is possible.
Ethereum Loses Bullish Dominance in Two Major Zones
Ethereum currently trades around $3,939, which means that the altcoin’s price has increased by 67.30% in 2024. One indicator that played a key role in ETH’s rally during the year is its Open Interest (OI).
The OI refers to the value of the sum of all open contracts in the market. When it increases, it means that more liquidity has flowed into contracts related to a cryptocurrency. In the derivatives market, this indicates rising buying pressure, which could lead to higher prices.
On the flip side, a decrease in the OI indicates selling pressure. The decline suggests that traders are increasingly closing their positions and withdrawing liquidity from the market.
According to Santiment, Ethereum’s OI climbed to $14.50 billion yesterday, December 15. However, as of this writing, it has decreased to $13.94 billion, indicating that exposure to ETH has reduced. Given the conditions above, this decline suggests that Ethereum Price risks another decline if the OI sustains this position.
Another indicator that supports this bias is the Ethereum exchange inflow. Exchange inflow is the mean amount of coins per transaction sent to exchanges. A high value suggests that investors are transferring larger amounts, signaling increased selling pressure, which could potentially drive prices lower.
A low exchange inflow in the metric, however, suggests a decline in selling pressure. According to CryptoQuant, the exchange inflow has climbed from what it was on December 14, indicating that selling pressure around ETH has increased.
If sustained, this could hinder the cryptocurrency from rising toward $4,500 or hitting a new all-time high before 2024 closes.
ETH Price Prediction: Now $4,500 Yet
According to the daily chart, the Parabolic Stop-and-Reverse (SAR) indicator has risen above ETH’s price. The SAR is a technical indicator that shows whether a cryptocurrency has encountered resistance or solid support.
When the dotted lines are below the price, it indicates significant support that could drive prices higher. However, currently, the dotted lines are above Ethereum’s price. Therefore, the cryptocurrency is facing resistance.
As long as ETH trades below the indicator, the price is likely to fall, with possible targets around $3,315. If that is the case, then Ethereum’s price might not hit a new all-time high before the year ends.
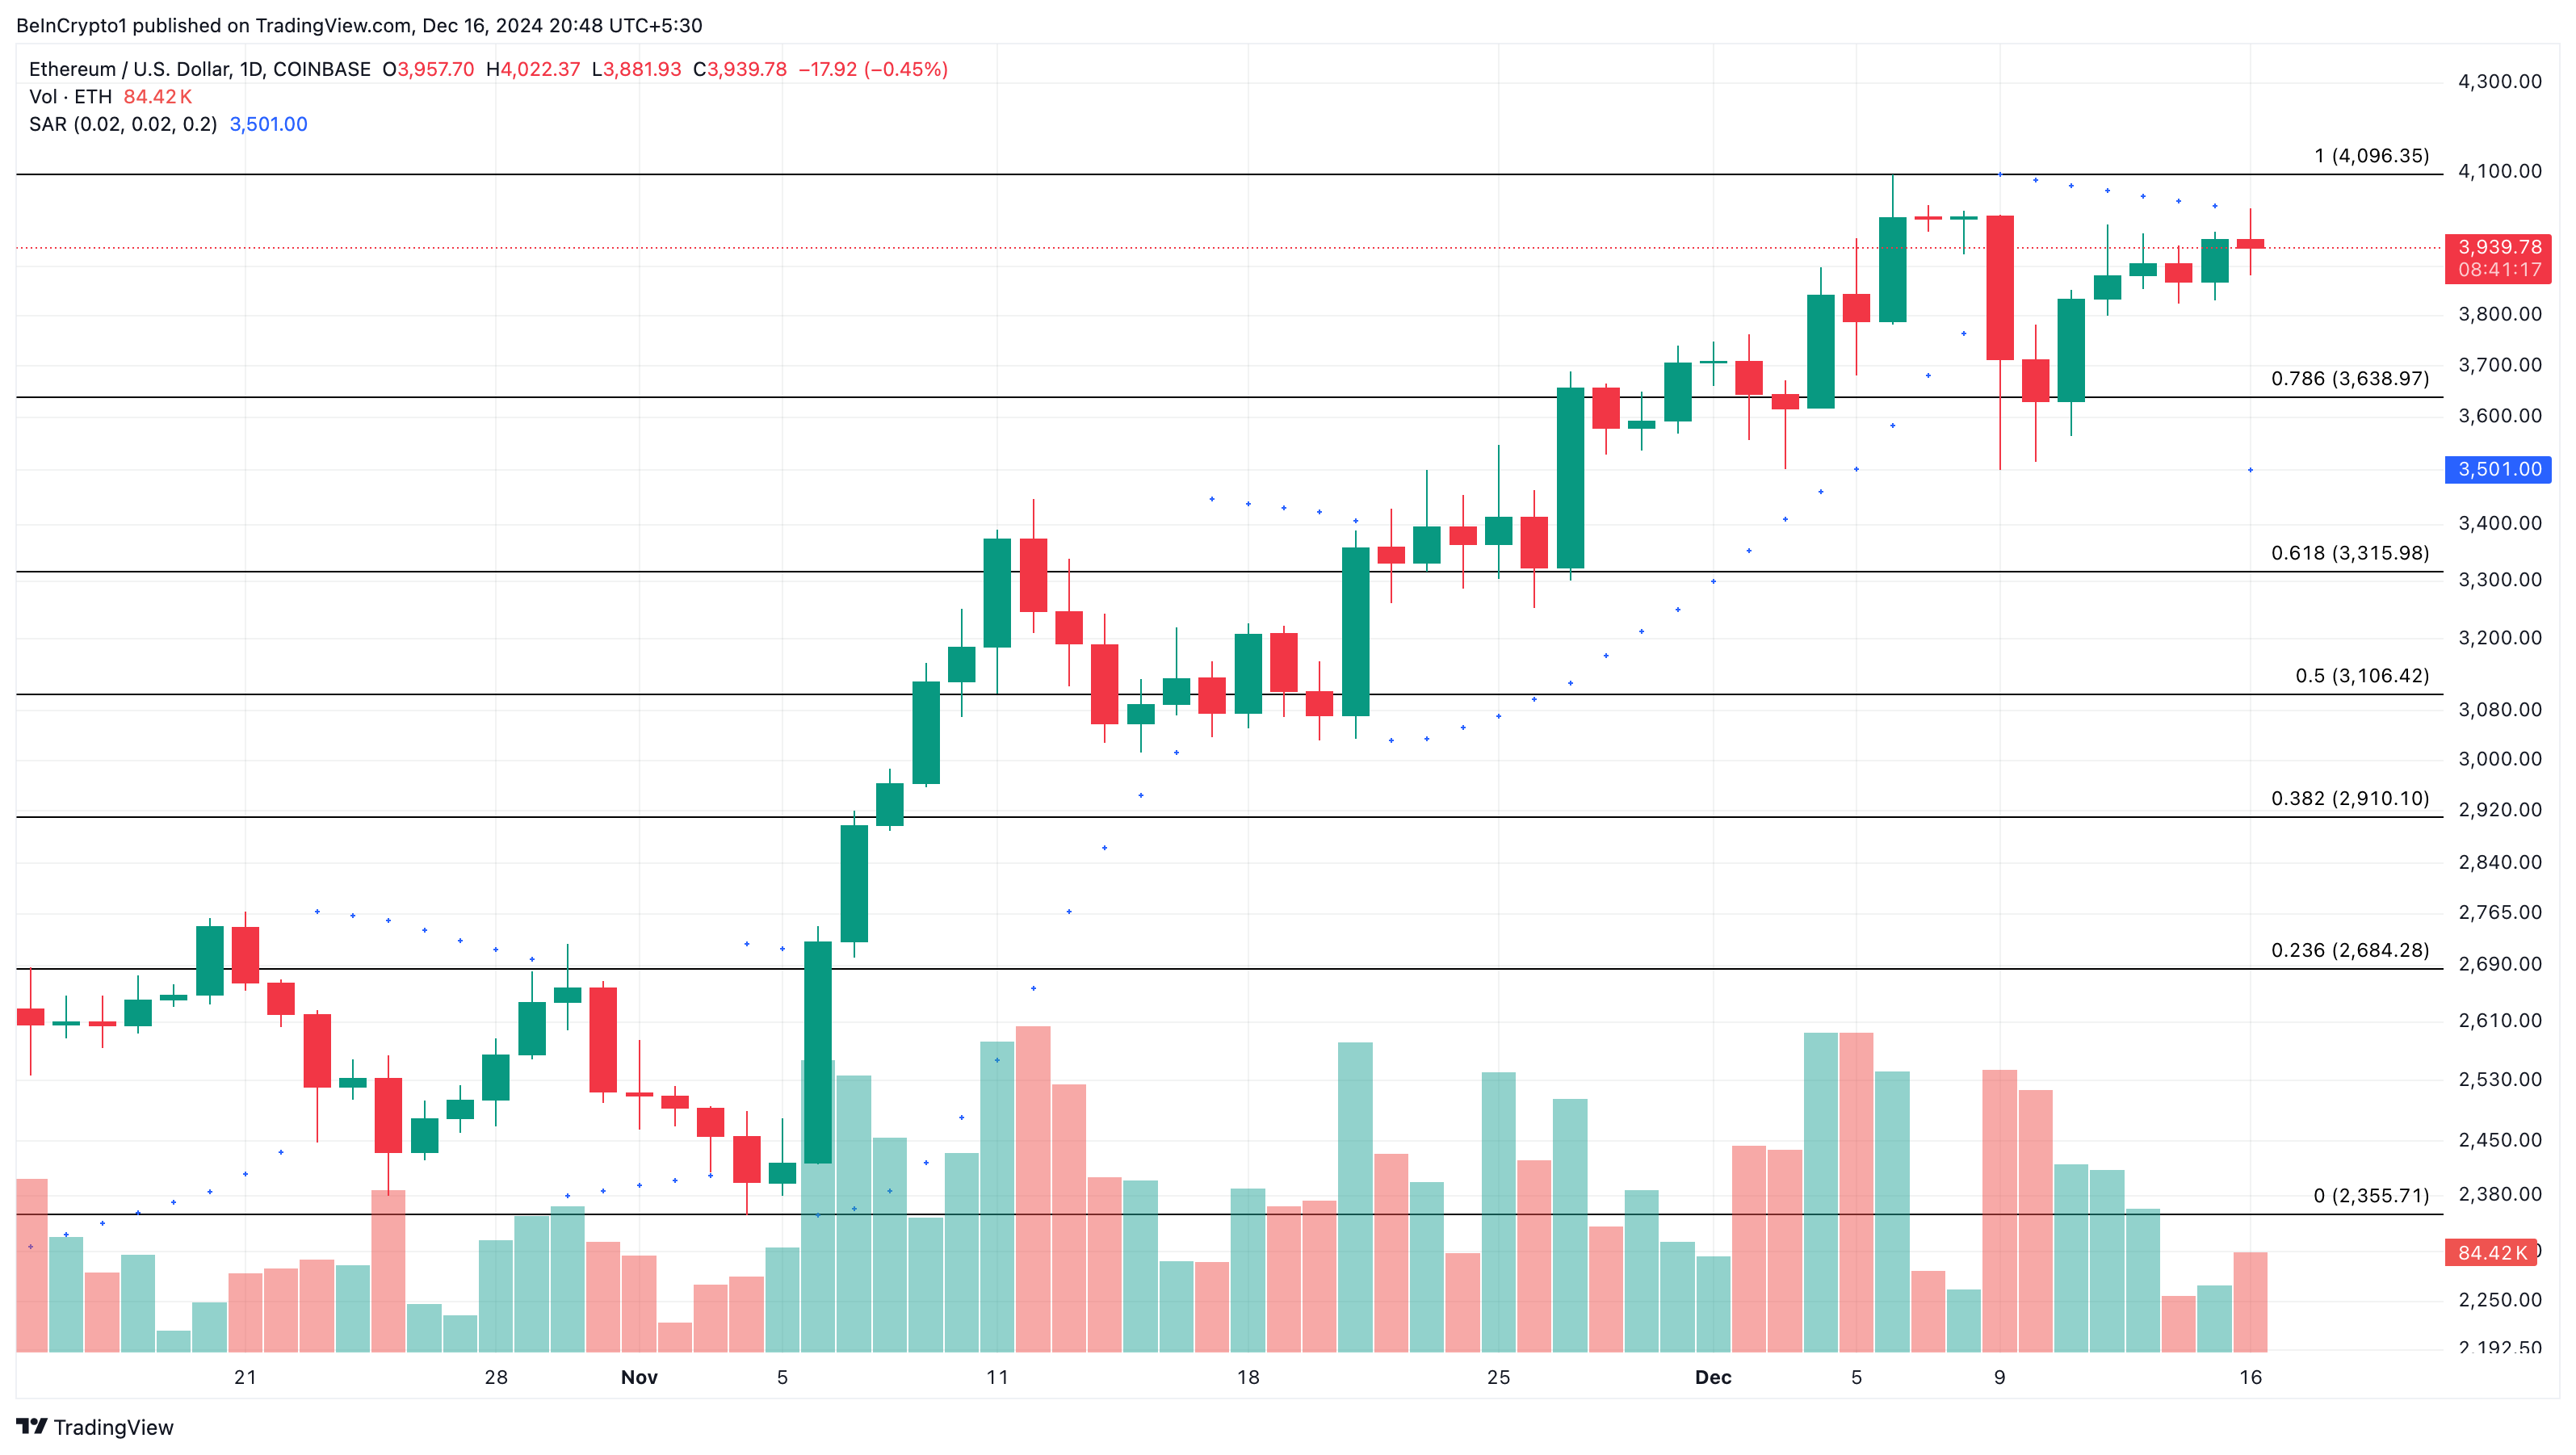
However, if Open Interest increases and exchange inflow drops to an extremely low point, the forecast might be invalidated.
免责声明:投资有风险,本文并非投资建议,以上内容不应被视为任何金融产品的购买或出售要约、建议或邀请,作者或其他用户的任何相关讨论、评论或帖子也不应被视为此类内容。本文仅供一般参考,不考虑您的个人投资目标、财务状况或需求。TTM对信息的准确性和完整性不承担任何责任或保证,投资者应自行研究并在投资前寻求专业建议。
热议股票
- 1
- 2
- 3
- 4
- 5
- 6
- 7
- 8
- 9
- 10