Is the Recent Decline in TRX a Buying Opportunity?
- TRX forms bullish ascending triangle pattern, signaling potential breakout.
- Recent decline, but strong monthly growth and technical support levels.
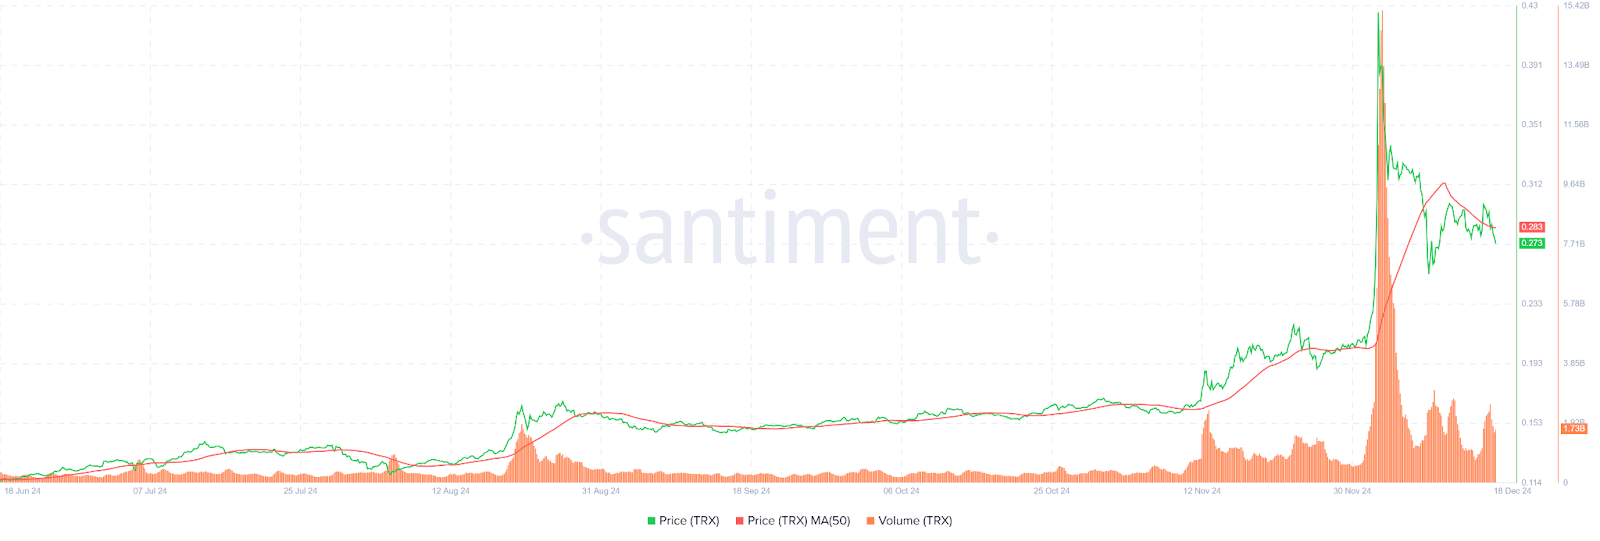
Tron (TRX) is currently trading at $0.2707, marking a 7.43% decline over the past 24 hours. The digital asset has also experienced a drop in trading volume, which has fallen by 22%. Earlier today, Tron reached a seven-day low of $0.2700, yet its performance over the past month reveals a 32% increase, showing an upward momentum. Despite the recent pullback, TRX is still 38% away from its all-time high (ATH).
Technical analysis suggests a potential for further growth, with TRX forming an ascending triangle pattern. This pattern is typically associated with a bullish trend and is characterized by a horizontal upper trendline that indicates a consistent resistance level, coupled with a rising lower trendline reflecting increased buying pressure. As the price nears the apex of the triangle, the battle between buyers and sellers intensifies, which could result in a breakout.
Tron To Surge Amid Bearish Pressure?
Traders are closely monitoring the resistance levels at $0.3116 (R1) and $0.3920 (R2), as these points could indicate the key breakout levels. On the downside, support levels are positioned at $0.2699 (S1) and $0.2406 (S2), providing a safety net for the asset in case of further declines.
The Relative Strength Index (RSI) is currently at 51, suggesting that TRX is in a neutral zone, neither overbought nor oversold. This indicates that the asset is not currently facing strong upward or downward pressure, but it could go either way as it approaches the triangle’s apex.
In summary, while Tron has experienced a slight dip recently, analysts suggest its long-term prospects look promising. The ascending triangle pattern suggests a potential breakout to the upside, and with strong support levels in place, TRX traders will be keeping a close eye on the coming days for confirmation of a bullish move.
Highlighted News Of The Day
LINK Struggles Below Key Levels as Bulls Dominate Crypto Market
免责声明:投资有风险,本文并非投资建议,以上内容不应被视为任何金融产品的购买或出售要约、建议或邀请,作者或其他用户的任何相关讨论、评论或帖子也不应被视为此类内容。本文仅供一般参考,不考虑您的个人投资目标、财务状况或需求。TTM对信息的准确性和完整性不承担任何责任或保证,投资者应自行研究并在投资前寻求专业建议。
热议股票
- 1
- 2
- 3
- 4
- 5
- 6
- 7
- 8
- 9
- 10