Are Investors Undervaluing Riverstone Holdings Limited (SGX:AP4) By 47%?
Key Insights
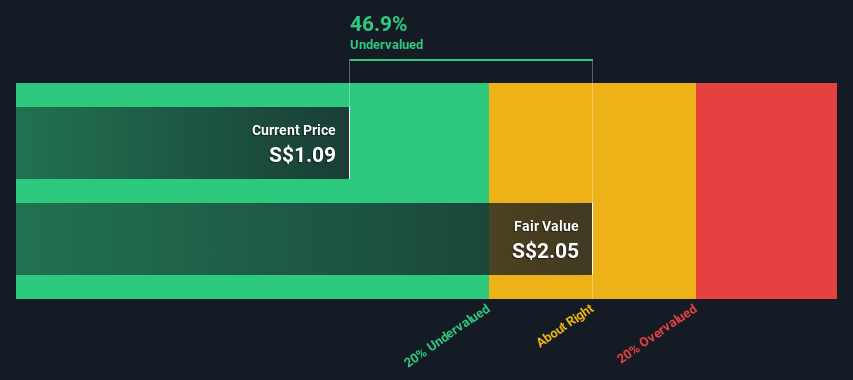
- Using the 2 Stage Free Cash Flow to Equity, Riverstone Holdings fair value estimate is S$2.05
- Riverstone Holdings' S$1.09 share price signals that it might be 47% undervalued
- Our fair value estimate is 79% higher than Riverstone Holdings' analyst price target of RM1.15
Today we will run through one way of estimating the intrinsic value of Riverstone Holdings Limited (SGX:AP4) by taking the forecast future cash flows of the company and discounting them back to today's value. Our analysis will employ the Discounted Cash Flow (DCF) model. There's really not all that much to it, even though it might appear quite complex.
Companies can be valued in a lot of ways, so we would point out that a DCF is not perfect for every situation. If you still have some burning questions about this type of valuation, take a look at the Simply Wall St analysis model.
Check out our latest analysis for Riverstone Holdings
The Model
We're using the 2-stage growth model, which simply means we take in account two stages of company's growth. In the initial period the company may have a higher growth rate and the second stage is usually assumed to have a stable growth rate. In the first stage we need to estimate the cash flows to the business over the next ten years. Where possible we use analyst estimates, but when these aren't available we extrapolate the previous free cash flow (FCF) from the last estimate or reported value. We assume companies with shrinking free cash flow will slow their rate of shrinkage, and that companies with growing free cash flow will see their growth rate slow, over this period. We do this to reflect that growth tends to slow more in the early years than it does in later years.
A DCF is all about the idea that a dollar in the future is less valuable than a dollar today, so we discount the value of these future cash flows to their estimated value in today's dollars:
10-year free cash flow (FCF) estimate
| 2025 | 2026 | 2027 | 2028 | 2029 | 2030 | 2031 | 2032 | 2033 | 2034 | |
| Levered FCF (MYR, Millions) | RM289.1m | RM328.8m | RM368.8m | RM393.7m | RM412.9m | RM429.8m | RM444.9m | RM458.8m | RM471.8m | RM484.4m |
| Growth Rate Estimate Source | Analyst x3 | Analyst x3 | Analyst x1 | Analyst x1 | Est @ 4.87% | Est @ 4.08% | Est @ 3.52% | Est @ 3.12% | Est @ 2.85% | Est @ 2.66% |
| Present Value (MYR, Millions) Discounted @ 6.0% | RM273 | RM292 | RM309 | RM311 | RM308 | RM302 | RM295 | RM287 | RM278 | RM270 |
("Est" = FCF growth rate estimated by Simply Wall St)Present Value of 10-year Cash Flow (PVCF) = RM2.9b
We now need to calculate the Terminal Value, which accounts for all the future cash flows after this ten year period. For a number of reasons a very conservative growth rate is used that cannot exceed that of a country's GDP growth. In this case we have used the 5-year average of the 10-year government bond yield (2.2%) to estimate future growth. In the same way as with the 10-year 'growth' period, we discount future cash flows to today's value, using a cost of equity of 6.0%.
Terminal Value (TV)= FCF2034 × (1 + g) ÷ (r – g) = RM484m× (1 + 2.2%) ÷ (6.0%– 2.2%) = RM13b
Present Value of Terminal Value (PVTV)= TV / (1 + r)10= RM13b÷ ( 1 + 6.0%)10= RM7.2b
The total value is the sum of cash flows for the next ten years plus the discounted terminal value, which results in the Total Equity Value, which in this case is RM10b. In the final step we divide the equity value by the number of shares outstanding. Compared to the current share price of S$1.1, the company appears quite undervalued at a 47% discount to where the stock price trades currently. Valuations are imprecise instruments though, rather like a telescope - move a few degrees and end up in a different galaxy. Do keep this in mind.
Important Assumptions
The calculation above is very dependent on two assumptions. The first is the discount rate and the other is the cash flows. If you don't agree with these result, have a go at the calculation yourself and play with the assumptions. The DCF also does not consider the possible cyclicality of an industry, or a company's future capital requirements, so it does not give a full picture of a company's potential performance. Given that we are looking at Riverstone Holdings as potential shareholders, the cost of equity is used as the discount rate, rather than the cost of capital (or weighted average cost of capital, WACC) which accounts for debt. In this calculation we've used 6.0%, which is based on a levered beta of 0.929. Beta is a measure of a stock's volatility, compared to the market as a whole. We get our beta from the industry average beta of globally comparable companies, with an imposed limit between 0.8 and 2.0, which is a reasonable range for a stable business.
SWOT Analysis for Riverstone Holdings
- Earnings growth over the past year exceeded the industry.
- Currently debt free.
- Balance sheet summary for AP4.
- Dividend is low compared to the top 25% of dividend payers in the Medical Equipment market.
- Annual revenue is forecast to grow faster than the Singaporean market.
- Good value based on P/E ratio and estimated fair value.
- Dividends are not covered by earnings and cashflows.
- Annual earnings are forecast to grow slower than the Singaporean market.
- See AP4's dividend history.
Looking Ahead:
Although the valuation of a company is important, it ideally won't be the sole piece of analysis you scrutinize for a company. DCF models are not the be-all and end-all of investment valuation. Preferably you'd apply different cases and assumptions and see how they would impact the company's valuation. For example, changes in the company's cost of equity or the risk free rate can significantly impact the valuation. Can we work out why the company is trading at a discount to intrinsic value? For Riverstone Holdings, we've compiled three relevant elements you should assess:
- Risks: Every company has them, and we've spotted 1 warning sign for Riverstone Holdings you should know about.
- Future Earnings: How does AP4's growth rate compare to its peers and the wider market? Dig deeper into the analyst consensus number for the upcoming years by interacting with our free analyst growth expectation chart.
- Other Solid Businesses: Low debt, high returns on equity and good past performance are fundamental to a strong business. Why not explore our interactive list of stocks with solid business fundamentals to see if there are other companies you may not have considered!
PS. The Simply Wall St app conducts a discounted cash flow valuation for every stock on the SGX every day. If you want to find the calculation for other stocks just search here.
New: AI Stock Screener & Alerts
Our new AI Stock Screener scans the market every day to uncover opportunities.
• Dividend Powerhouses (3%+ Yield)• Undervalued Small Caps with Insider Buying• High growth Tech and AI CompaniesOr build your own from over 50 metrics.
Explore Now for FreeHave feedback on this article? Concerned about the content? Get in touch with us directly. Alternatively, email editorial-team (at) simplywallst.com.This article by Simply Wall St is general in nature. We provide commentary based on historical data and analyst forecasts only using an unbiased methodology and our articles are not intended to be financial advice. It does not constitute a recommendation to buy or sell any stock, and does not take account of your objectives, or your financial situation. We aim to bring you long-term focused analysis driven by fundamental data. Note that our analysis may not factor in the latest price-sensitive company announcements or qualitative material. Simply Wall St has no position in any stocks mentioned.
免责声明:投资有风险,本文并非投资建议,以上内容不应被视为任何金融产品的购买或出售要约、建议或邀请,作者或其他用户的任何相关讨论、评论或帖子也不应被视为此类内容。本文仅供一般参考,不考虑您的个人投资目标、财务状况或需求。TTM对信息的准确性和完整性不承担任何责任或保证,投资者应自行研究并在投资前寻求专业建议。
热议股票
- 1
- 2
- 3
- 4
- 5
- 6
- 7
- 8
- 9
- 10