Stellar (XLM) Price Surges 34% in a Week, but Bullish Momentum May Fade Soon
- XLM surged 34% in 7 days, trading between $0.47 resistance and $0.41 support, driven by a golden cross formation.
- Indicators like ADX and CMF show waning momentum, as selling pressure rises and buying dominance diminishes.
- Breaking $0.47 resistance could push XLM to $0.60, but failure at $0.41 support risks a sharp decline to $0.35 or lower.
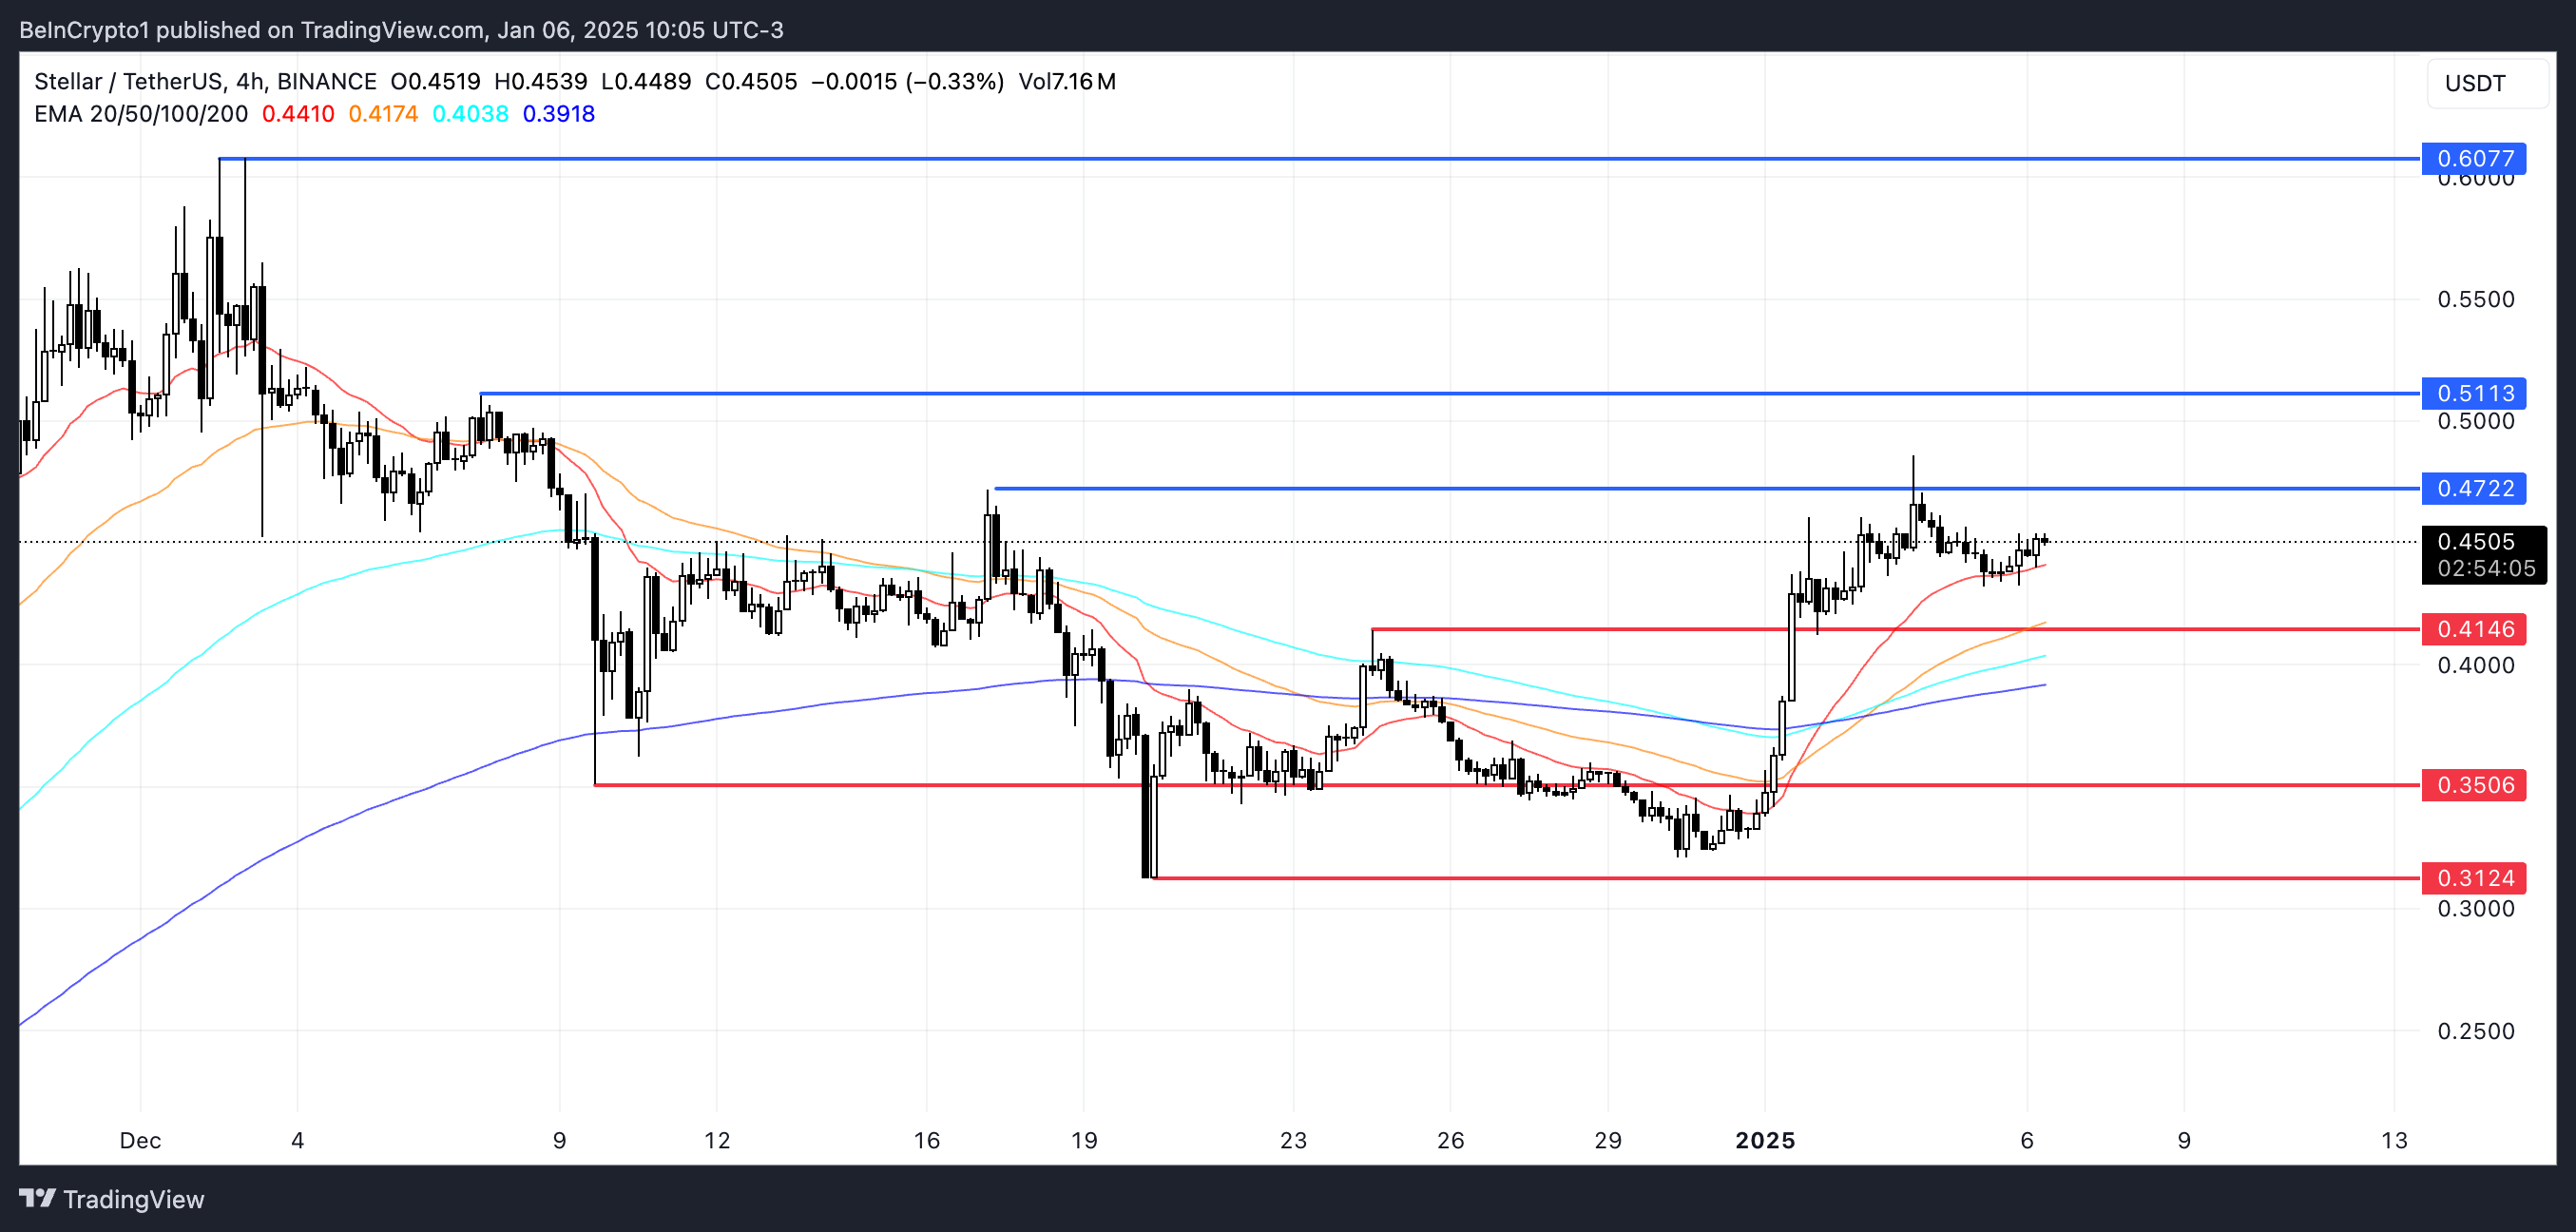
Stellar (XLM) price has surged 34% over the past seven days, demonstrating strong bullish momentum. The coin is trading between critical levels, with resistance at $0.47 and support at $0.41, as investors await its next move.
While recent gains have been driven by a golden cross formation, signals from the CMF and DMI indicate the uptrend may be losing steam. If XLM can break resistance at $0.47, it could target $0.51 or even $0.60, but failure to hold support at $0.41 may result in a sharp correction.
XLM Remains in an Uptrend, but Sellers May Take Over
The Average Directional Index (ADX) for XLM currently stands at 40.1, reflecting a strong trend, although it has declined from 52.6 two days ago. The ADX measures the strength of a trend on a scale from 0 to 100, with values above 25 indicating a strong trend and those below 20 signaling weak or absent momentum.
Despite the decline, the ADX remains firmly above the 25 threshold, confirming that Stellar is still in an uptrend, though the momentum appears to be easing.

The +DI, representing buying pressure, has dropped to 25 from 40.3 two days ago, while the -DI, which tracks selling pressure, has risen to 14.6 from 7.9.
This shift suggests that while buyers still maintain control, their dominance is waning as sellers gradually gain ground. If the trend continues, XLM uptrend could weaken further, potentially leading to consolidation or a reversal unless buying momentum strengthens.
Stellar CMF Is Down From Its Highest Value In One Year
The Chaikin Money Flow (CMF) for XLM is currently at -0.14, marking a significant shift from its peak of 0.41 on January 1, its highest value in one year. The CMF measures the flow of money into and out of an asset based on price and volume, with values above 0 indicating net buying pressure and values below 0 suggesting net selling pressure.
Stellar move into negative territory highlights a transition from strong inflows to increased outflows, signaling a shift in market sentiment.

This decline suggests that selling pressure has overtaken buying activity, which could weigh on XLM’s price in the short term. With the CMF falling from 0.17 just two days ago to its current level, the trend points to a loss of confidence among investors.
If the CMF remains negative or continues to drop, XLM price could face additional downward pressure. However, a recovery back into positive territory could signal renewed interest and potentially stabilize or lift the price.
XLM Price Prediction: Can Stellar Reclaim $0.60 In January?
XLM’s EMA lines highlight the golden cross that formed on January 1, which drove recent price gains. Currently, XLM is trading between a resistance at $0.47 and a support at $0.41, with the resistance acting as a barrier in past attempts.
If the $0.47 resistance is broken, Stellar price could rise to $0.51 and potentially test $0.60 if bullish momentum strengthens.

However, signals from the CMF and DMI suggest that the uptrend may be weakening. If the support at $0.41 fails, XLM price could face a significant pullback, potentially dropping to $0.35 or even $0.31.
免责声明:投资有风险,本文并非投资建议,以上内容不应被视为任何金融产品的购买或出售要约、建议或邀请,作者或其他用户的任何相关讨论、评论或帖子也不应被视为此类内容。本文仅供一般参考,不考虑您的个人投资目标、财务状况或需求。TTM对信息的准确性和完整性不承担任何责任或保证,投资者应自行研究并在投资前寻求专业建议。
热议股票
- 1
- 2
- 3
- 4
- 5
- 6
- 7
- 8
- 9
- 10