Ethena (ENA) Price Falls 18% as Death Cross Points to More Losses
- Ethena's price plummets 18%, pushing its market cap to $2.88B, with RSI at 26.4 signaling oversold conditions and potential rebound.
- CMF remains negative at -0.19, reflecting bearish sentiment, though capital outflows appear to be slowing from recent lows.
- A death cross could push ENA to $0.75, while a recovery above $1.01 resistance may signal bullish momentum and upside potential.
Ethena (ENA) price has dropped 18% in the last 24 hours, pushing its market cap below $3 billion. Despite this decline, ENA remains one of the top 50 largest cryptos by market cap.
Indicators like RSI and CMF reflect bearish sentiment but also hint at a possible rebound if conditions improve. Traders are closely watching key support levels at $0.89 and resistance levels at $1.01 for ENA’s next move.
Ethena RSI Is At Its Lowest Level In 5 Months
Ethena Relative Strength Index (RSI) has fallen to 26.4, marking its lowest level since August 2024. RSI is a momentum indicator that evaluates the speed and magnitude of price movements on a scale from 0 to 100.
Readings above 70 indicate overbought conditions and potential for price corrections, while values below 30 suggest oversold conditions and the possibility of a price recovery. The sharp drop from 79.9 on January 3 to its current level reflects a significant shift in market sentiment, with heavy selling pressure dominating over the past five days.
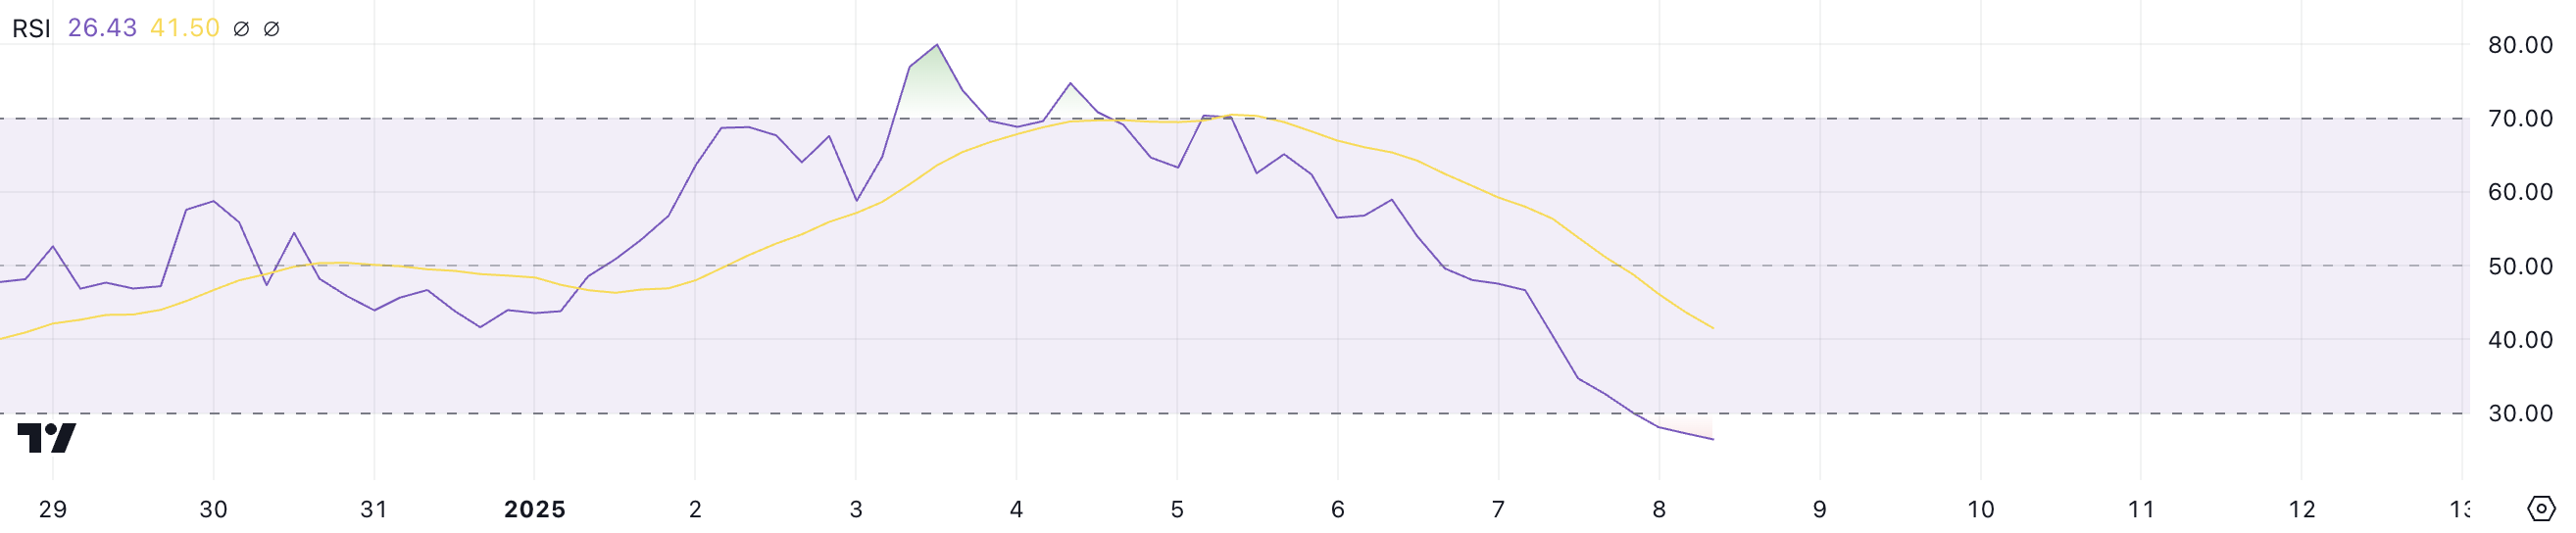
At 26.4, ENA RSI is now firmly in oversold territory, signaling that the recent sell-off may have been overdone. This could create conditions for a price rebound if buying interest returns to the market.
However, the bearish momentum driving the RSI lower also indicates weak investor confidence, suggesting that ENA’s price might remain under pressure in the short term.
ENA CMF Is Recovering from Yesterday’s Lows
Ethena Chaikin Money Flow (CMF) is currently at -0.19, showing a slight recovery from yesterday’s low of -0.25. CMF is a technical indicator that measures the flow of capital into or out of an asset based on price and volume over a specified period.
Positive CMF values indicate net buying pressure, signaling potential bullish momentum, while negative values reflect net selling pressure, suggesting bearish sentiment. The recent drop from a peak of 0.32 on January 3 to its current negative value highlights a significant shift in market sentiment, coinciding with ENA price decline from above $1.2.
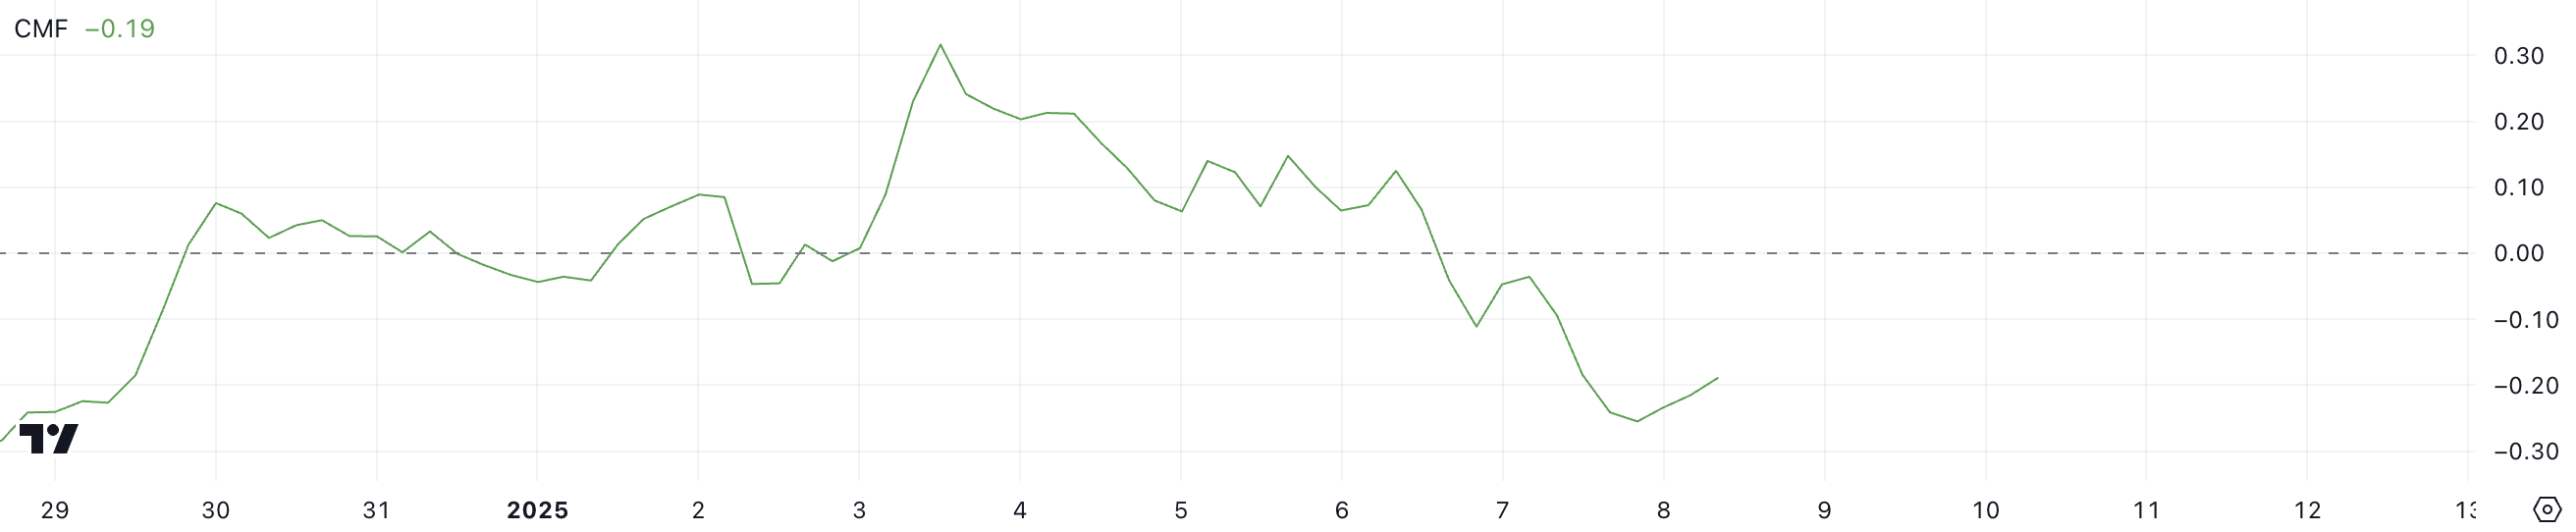
At -0.19, ENA’s CMF suggests that selling pressure is still dominant but may be starting to ease as the indicator recovers from its recent low. This slight improvement could indicate that capital outflows are slowing, providing a glimmer of hope for stabilization in Ethena price.
However, with the CMF still in negative territory, bearish sentiment remains in control, and further downside is possible unless the indicator moves closer to or above 0, signaling renewed buying interest.
ENA Price Prediction: Is $0.75 the Next Target for Ethena?
ENA EMA lines currently present a bearish setup, with the short-term lines trending downward. If this movement continues, it could lead to the formation of a death cross. This technical signal occurs when short-term EMAs cross below long-term EMAs, often indicating further downside momentum.
This bearish signal could intensify selling pressure, potentially pushing ENA price to test the support at $0.89. If this level is breached, the correction could deepen, with $0.75 as the next key target, representing a potential 21.8% decline from current levels.
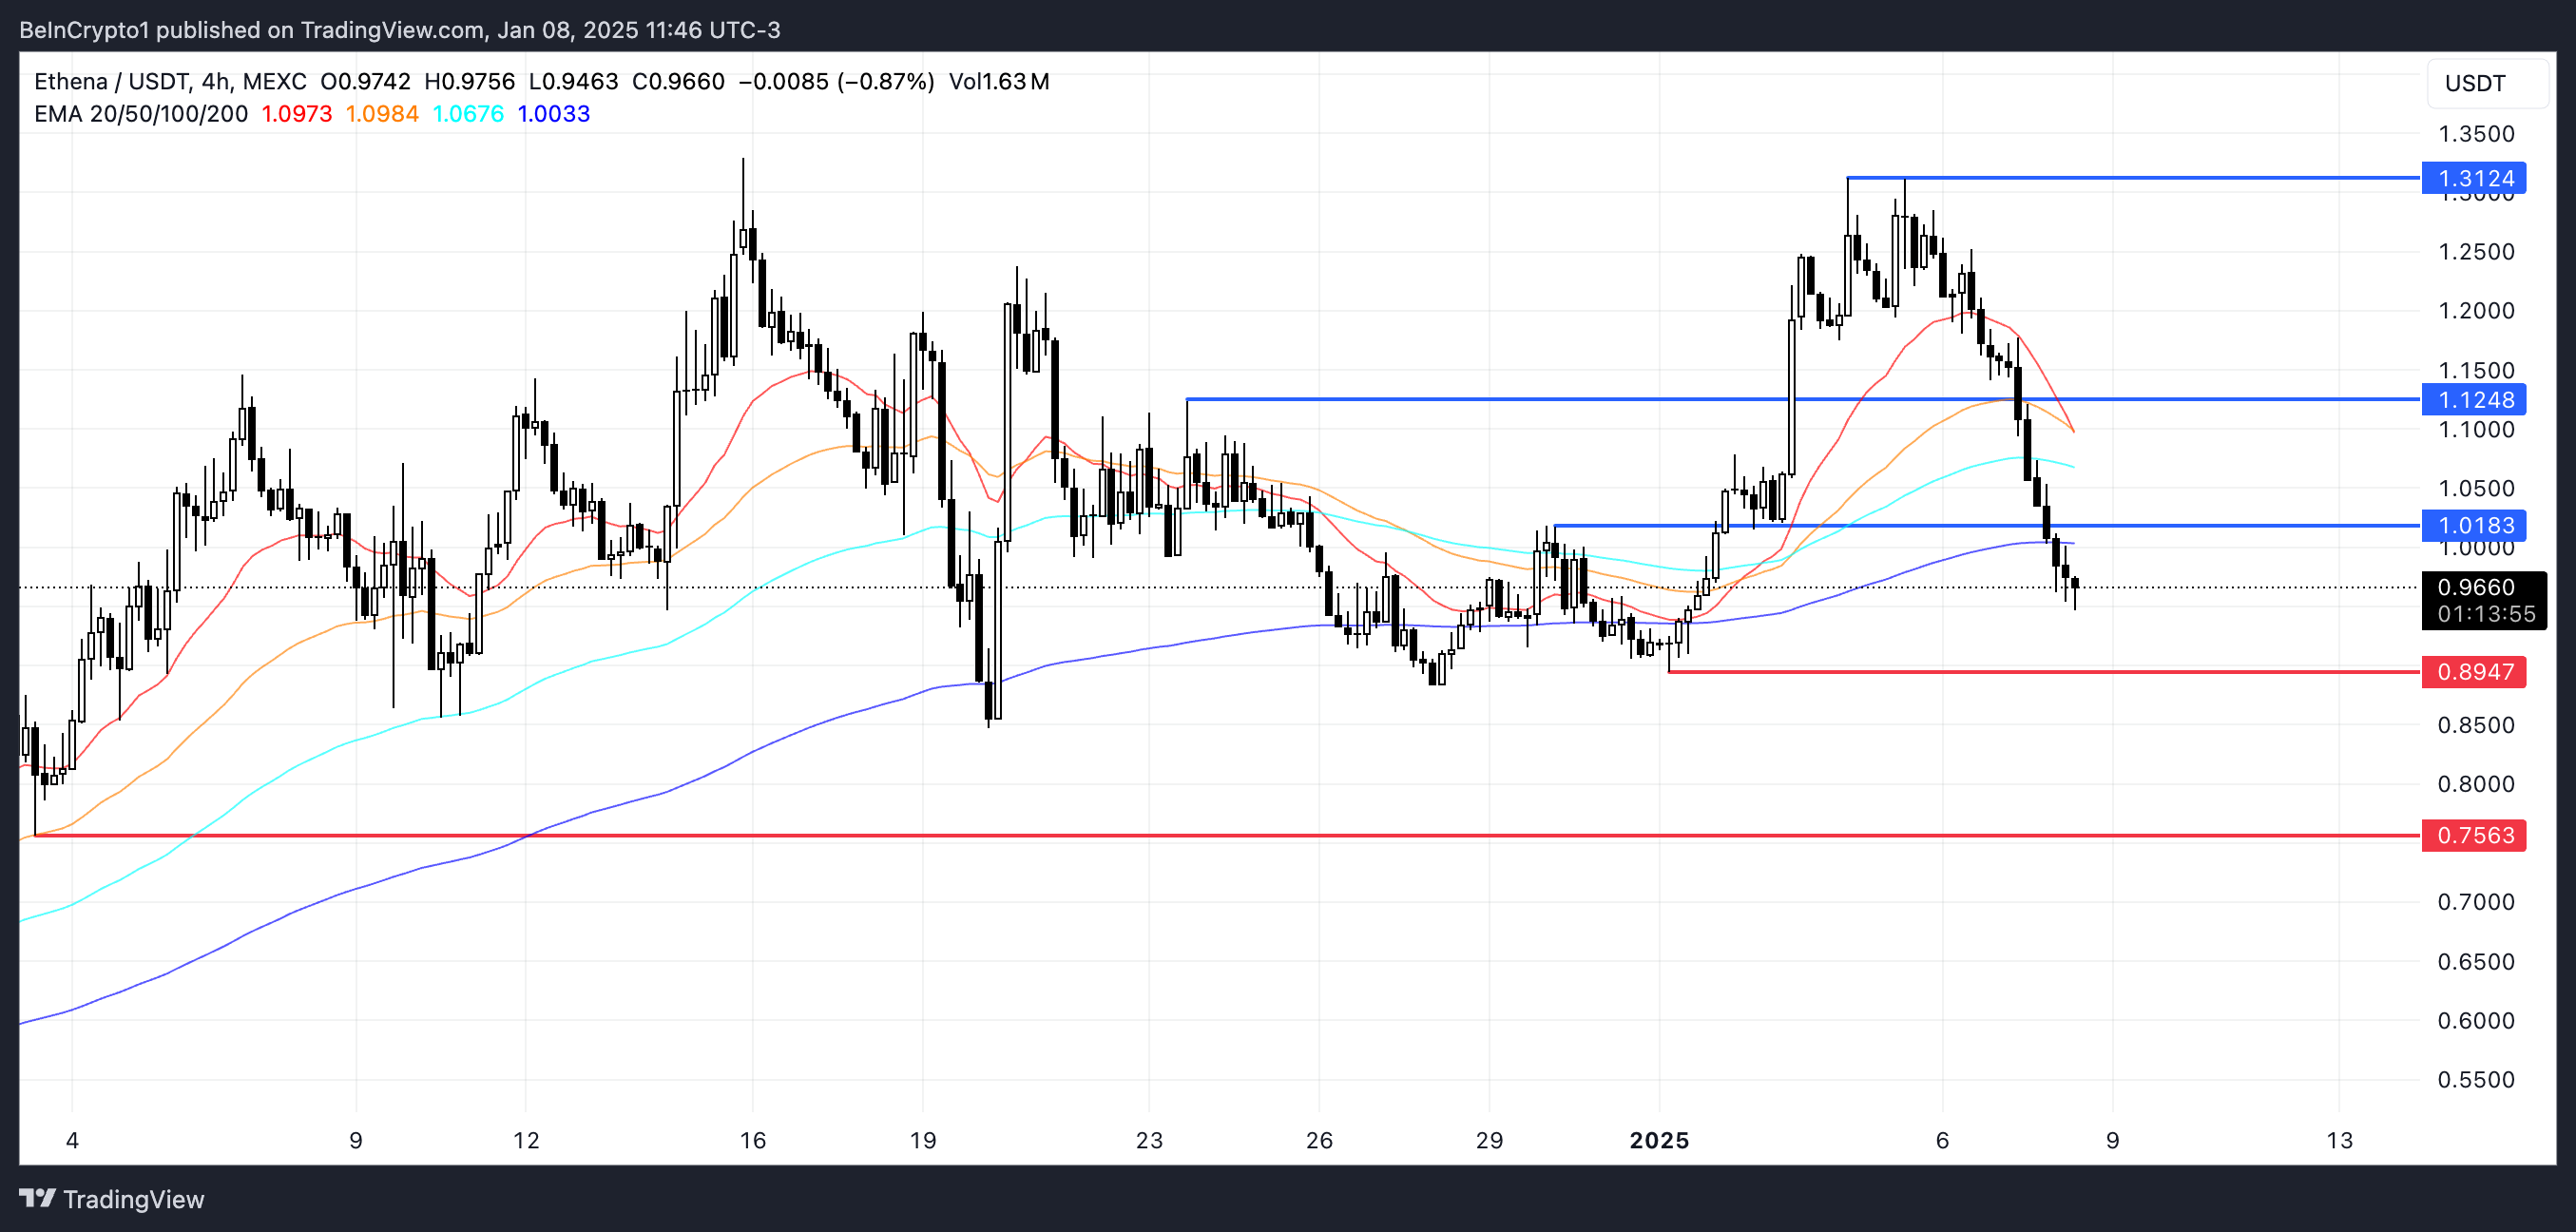
However, as suggested by RSI and CMF indicators, a rebound from current levels remains possible. If ENA price manages to regain bullish momentum, it could challenge the resistance at $1.01, and a breakout above this level might pave the way for further gains to $1.12.
With strong buying pressure and a sustained uptrend, Ethena could even aim for $1.31.
免责声明:投资有风险,本文并非投资建议,以上内容不应被视为任何金融产品的购买或出售要约、建议或邀请,作者或其他用户的任何相关讨论、评论或帖子也不应被视为此类内容。本文仅供一般参考,不考虑您的个人投资目标、财务状况或需求。TTM对信息的准确性和完整性不承担任何责任或保证,投资者应自行研究并在投资前寻求专业建议。
热议股票
- 1
- 2
- 3
- 4
- 5
- 6
- 7
- 8
- 9
- 10