Hyperliquid (HYPE) Price Declines 5% in 24 Hours, Market Cap Dips Below $7 Billion
- Hyperliquid falls 15% in seven days, dropping to 25th place by market cap amid transparency and centralization concerns.
- DMI shows bearish control intensifying, with selling pressure surging and a strengthening downtrend reflected in the ADX at 27.5.
- BBTrend turns positive, suggesting easing selling pressure and potential stabilization if buying momentum improves.
Hyperliquid (HYPE) price has fallen nearly 15% over the last seven days, pushing its market cap to $6.8 billion and dropping it out of the top 20 cryptocurrencies to 25th place. This decline comes amid mounting criticism focusing on the project’s transparency and perceived centralization issues.
Despite the downtrend, technical indicators suggest contrasting signals. The DMI points to continued bearish momentum, while the BBTrend hints at a possible stabilization. Whether HYPE can reverse its current course will likely depend on renewed investor confidence and overcoming its existing market challenges.
Hyperliquid Downtrend is Getting Stronger
The Average Directional Index (ADX) for HYPE has climbed to 27.5, up from 12.6 on January 7, signaling a strengthening trend. The ADX is a technical indicator that measures the strength of a trend, regardless of its direction, on a scale from 0 to 100. Values above 25 indicate a strong trend, while those below 20 suggest weak or absent momentum.
The increase in ADX suggests that HYPE’s current downtrend is gaining traction, reflecting heightened market activity and solidifying bearish control.
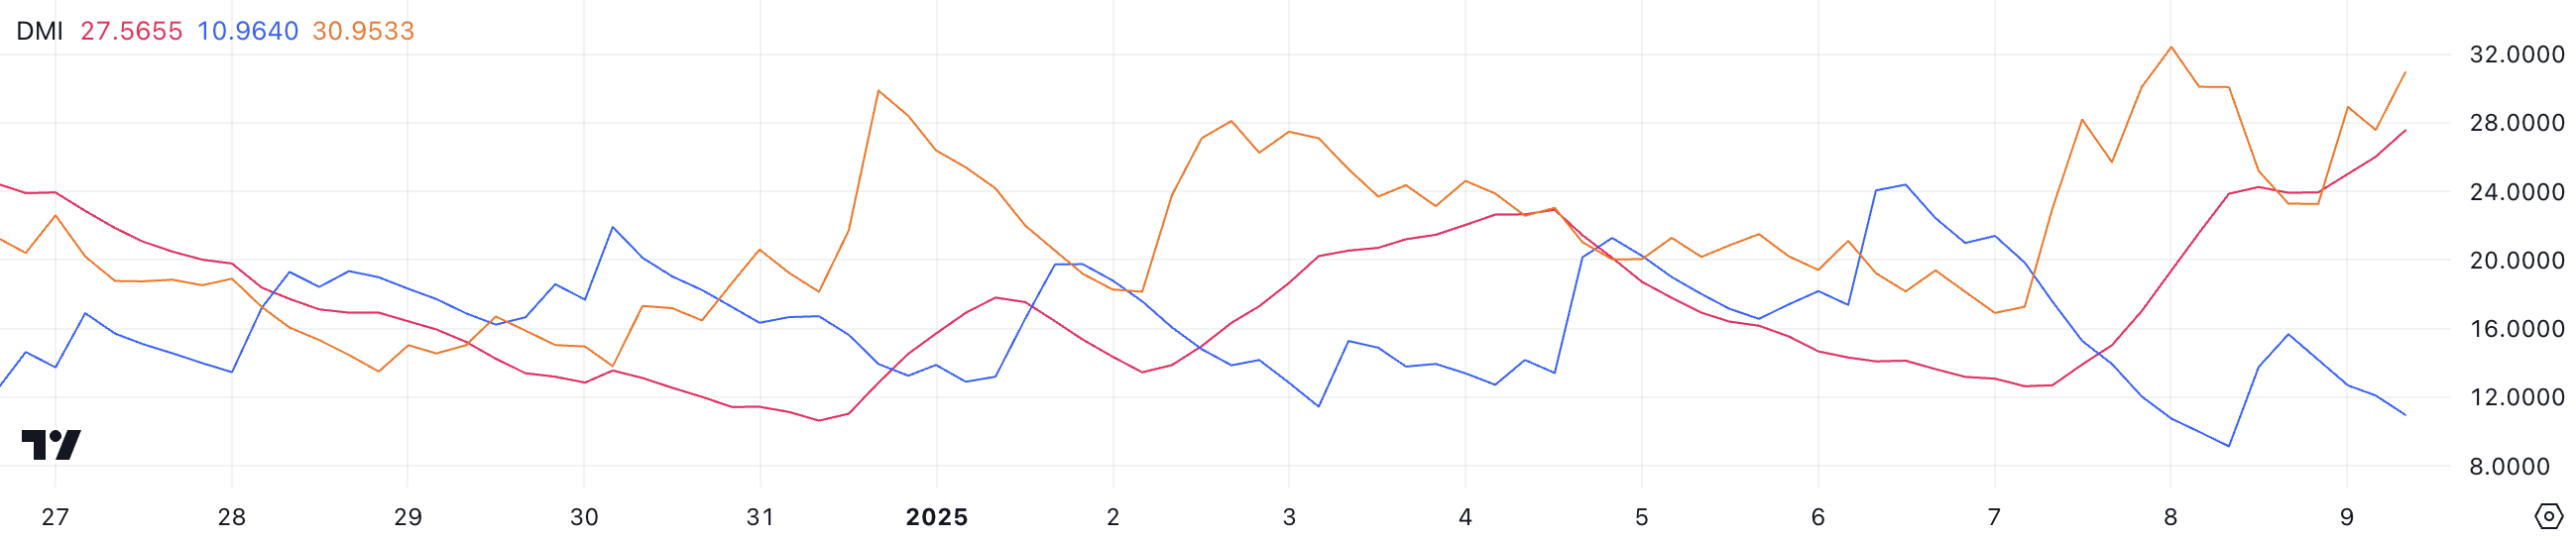
Supporting this, the +DI, representing buying pressure, has dropped significantly from 24.3 to 10.9 over the past three days, highlighting weakened bullish sentiment. In contrast, the -DI, which measures selling pressure, has surged from 18.1 to 30.9 during the same period, showing intensified bearish activity.
This shift in directional indicators confirms that sellers are in control of the market, potentially driving Hyperliquid to further downside unless a substantial resurgence of buying pressure occurs. The rising ADX, coupled with the declining +DI and increasing -DI, points to a continuation of the downtrend in the short term.
Positive BBTrend Offers Hope for HYPE
Hyperliquid marked one of the biggest airdrops of 2024 and currently has a BBTrend at 5.9, showing steady growth from 0.27 just yesterday. BBTrend, derived from Bollinger Bands, measures the strength and direction of a trend. Positive values indicate bullish momentum, while negative values suggest bearish conditions.
HYPE’s BBTrend had remained negative between December 26 and January 7, reaching a low of -14.7 on December 28, reflecting significant bearish pressure during that period.
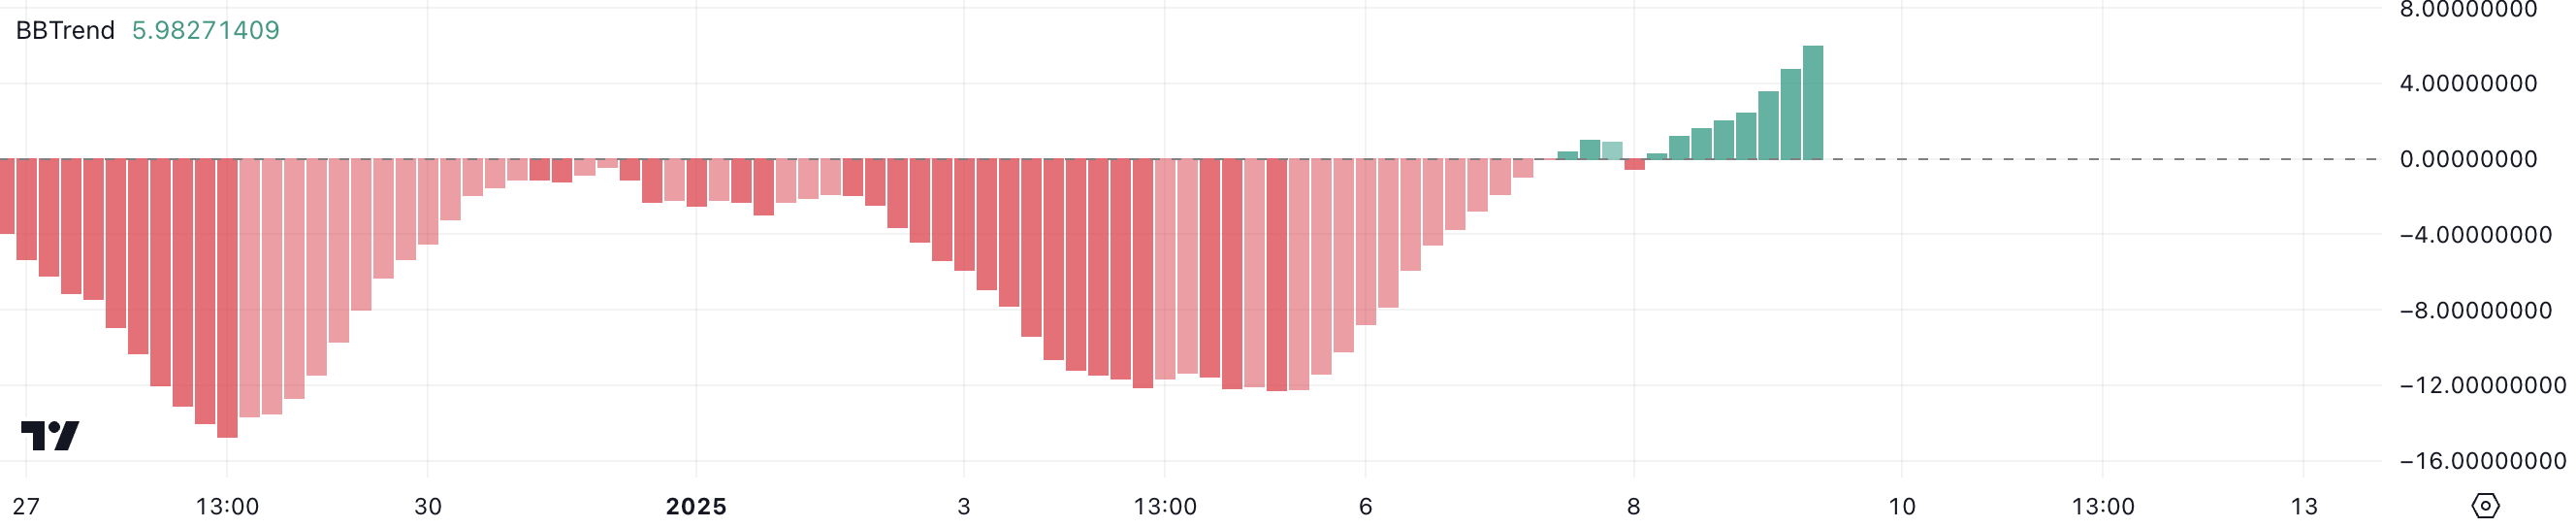
The recent move into positive territory suggests that selling pressure may be easing, even as HYPE remains in a downtrend and is down almost 15% over the past seven days, with recent critics around its transparency and decentralization concerns.
The improving BBTrend could indicate a potential stabilization or shift in sentiment. If the BBTrend continues to rise, it might signal an opportunity for a price recovery. However, sustained buying interest will be needed to counteract the existing bearish momentum and confirm a reversal.
HYPE Price Prediction: Will the Downtrend Continue?
HYPE downtrend appears poised to continue, as its total value locked (TVL) has dropped to a year-low, and its short-term EMA lines have crossed below the long-term ones.
This bearish setup suggests increasing downside momentum, with $14.99 identified as the next critical support level. If this level fails to hold, HYPE price could face a further decline, potentially dropping to $12, marking a significant 40% correction from current levels.
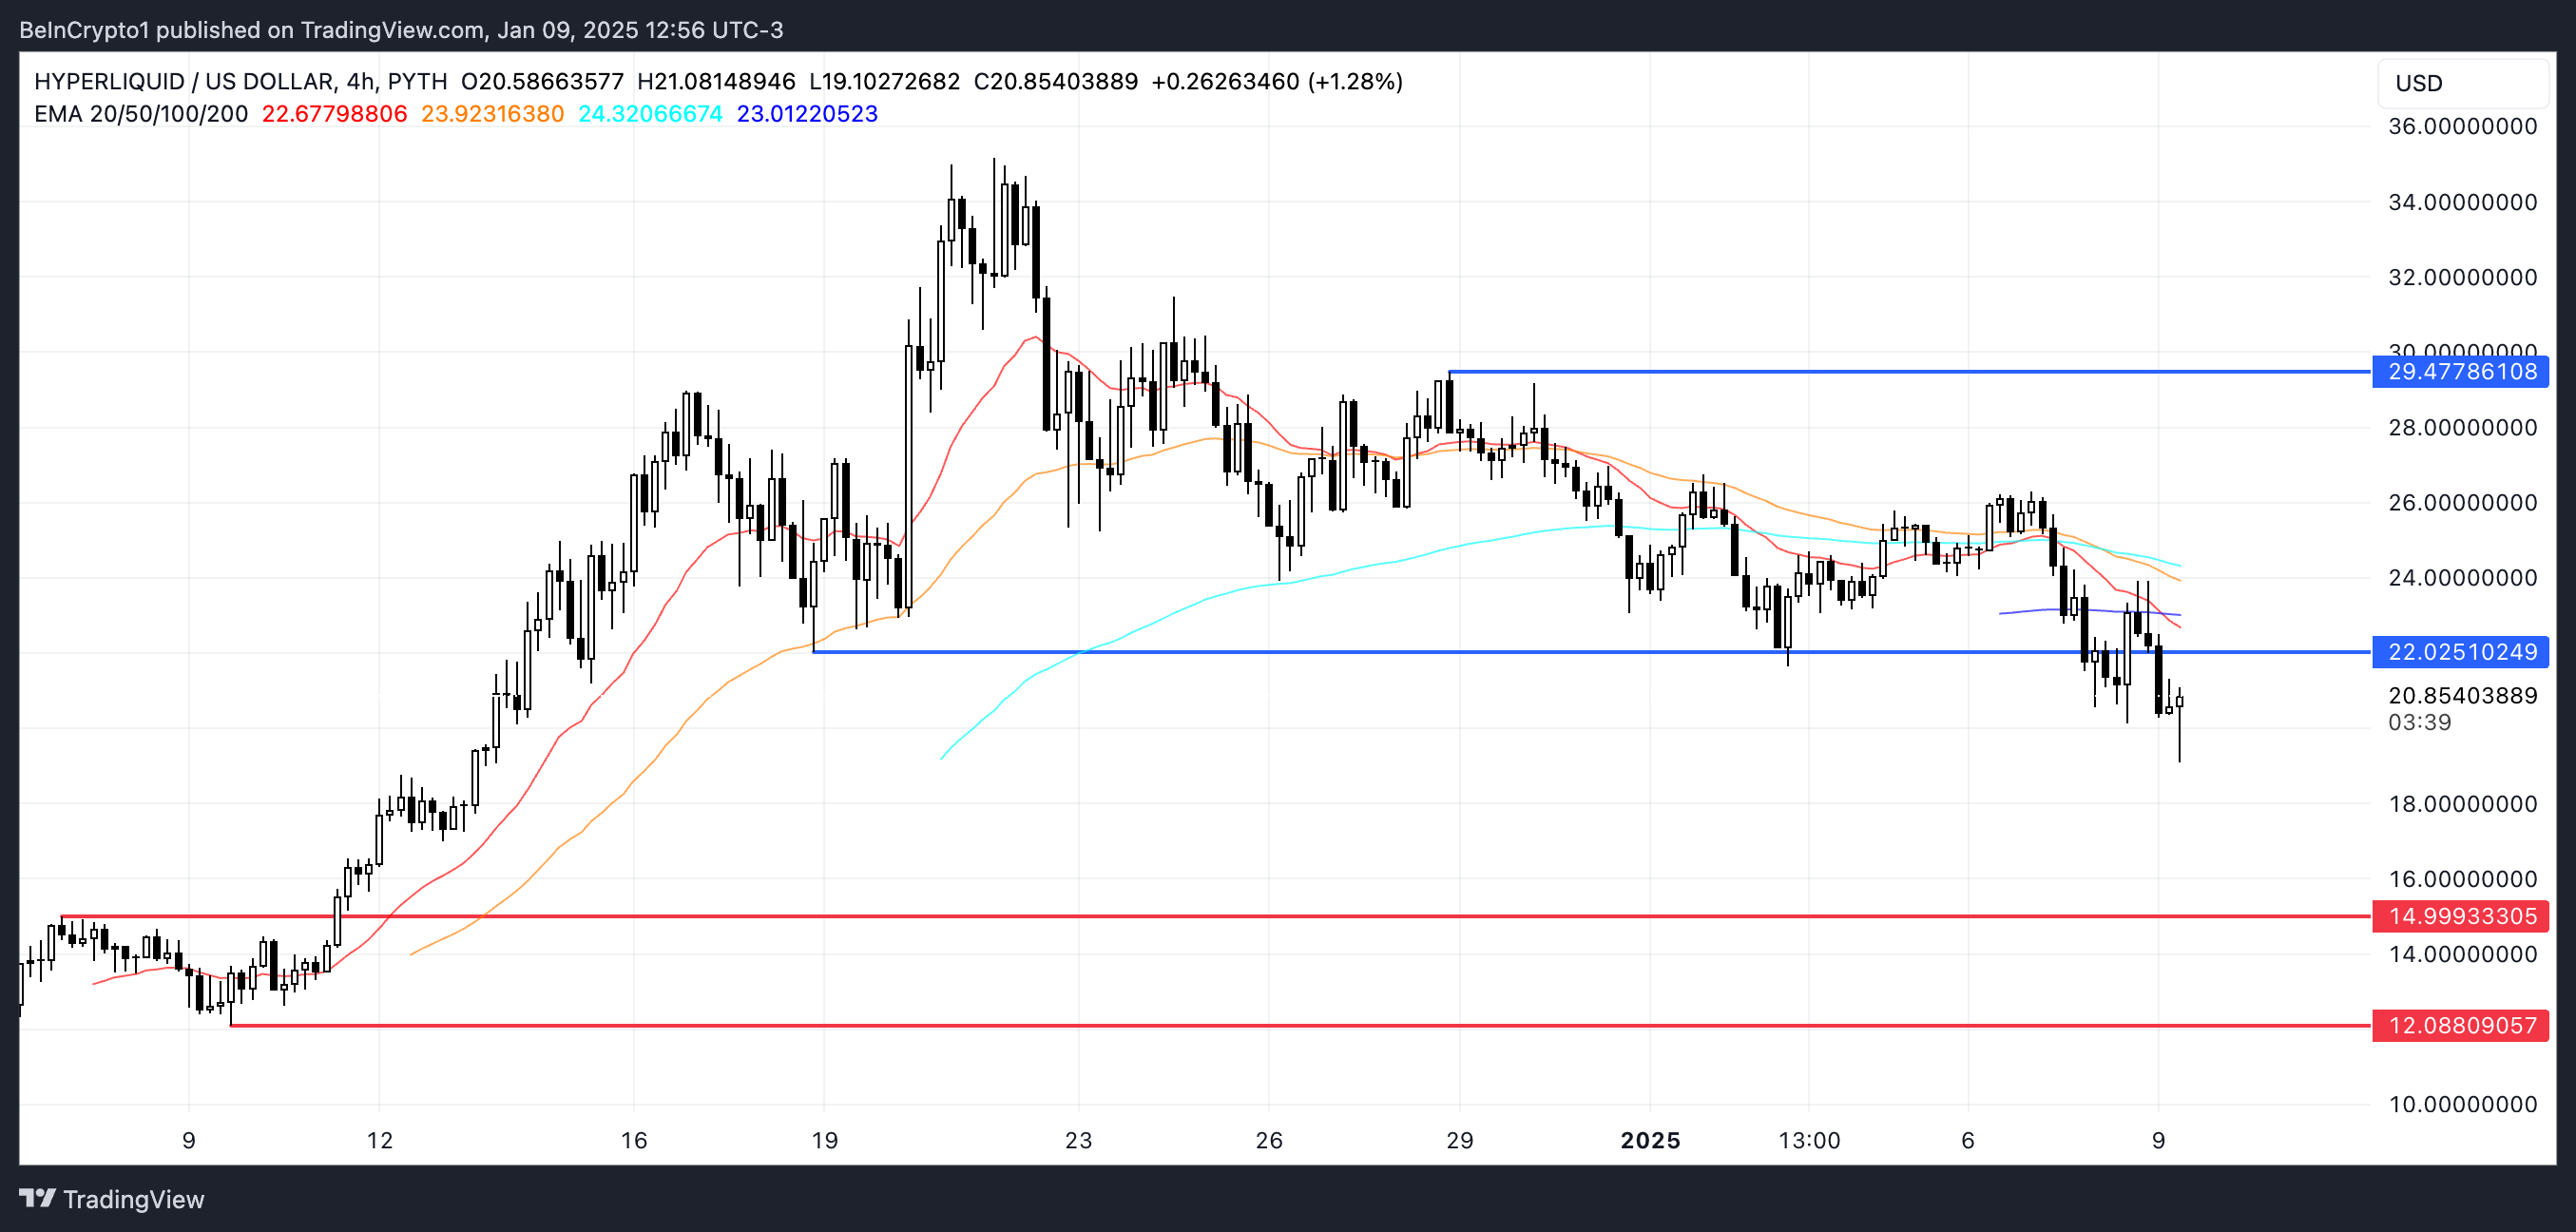
Conversely, if HYPE manages to reverse its trend, it could retest the resistance at $22. A breakout above this level, combined with strong upward momentum, might push the price to $29 and potentially above $30, bringing HYPE back to the top 20 altcoins in the market.
Such a recovery would bring HYPE closer to the levels it maintained during the latter half of December 2024.
免责声明:投资有风险,本文并非投资建议,以上内容不应被视为任何金融产品的购买或出售要约、建议或邀请,作者或其他用户的任何相关讨论、评论或帖子也不应被视为此类内容。本文仅供一般参考,不考虑您的个人投资目标、财务状况或需求。TTM对信息的准确性和完整性不承担任何责任或保证,投资者应自行研究并在投资前寻求专业建议。
热议股票
- 1
- 2
- 3
- 4
- 5
- 6
- 7
- 8
- 9
- 10