Sonic (S) Sees 500% Volume Surge While Indicators Flash Mixed Trends
- Sonic price rises 1.8% in 24 hours, with trading volume surging 500% to $114 million, supported by a strong ADX trend at 35.6.
- Golden cross formation on EMA lines signals potential further gains, but BBTrend at -6.8 reflects growing bearish pressure.
- Sonic faces resistance at $0.87, with a possible climb to $1.06, while support at $0.74 remains crucial to avoid a bearish reversal.
Sonic (formerly FTM) price has risen 1.8% in the last 24 hours, with trading volume surging 500% to $114 million. Technical indicators like the ADX and EMA lines suggest a strengthening uptrend, with the possibility of testing key resistance levels if momentum holds.
However, bearish signals from the BBTrend indicator point to mixed conditions, suggesting that traders should remain cautious about a potential reversal.
Sonic ADX Indicates a Strong Ongoing Uptrend
Sonic Average Directional Index (ADX) is currently at 35.6, a substantial rise from 21.9 just two days ago. This increase indicates a strong and strengthening trend, as the ADX has now moved well above the 25 threshold, which typically signals a strong trend.
The recent formation of a golden cross adds further bullish confirmation, suggesting that Sonic is positioned to extend its current uptrend.
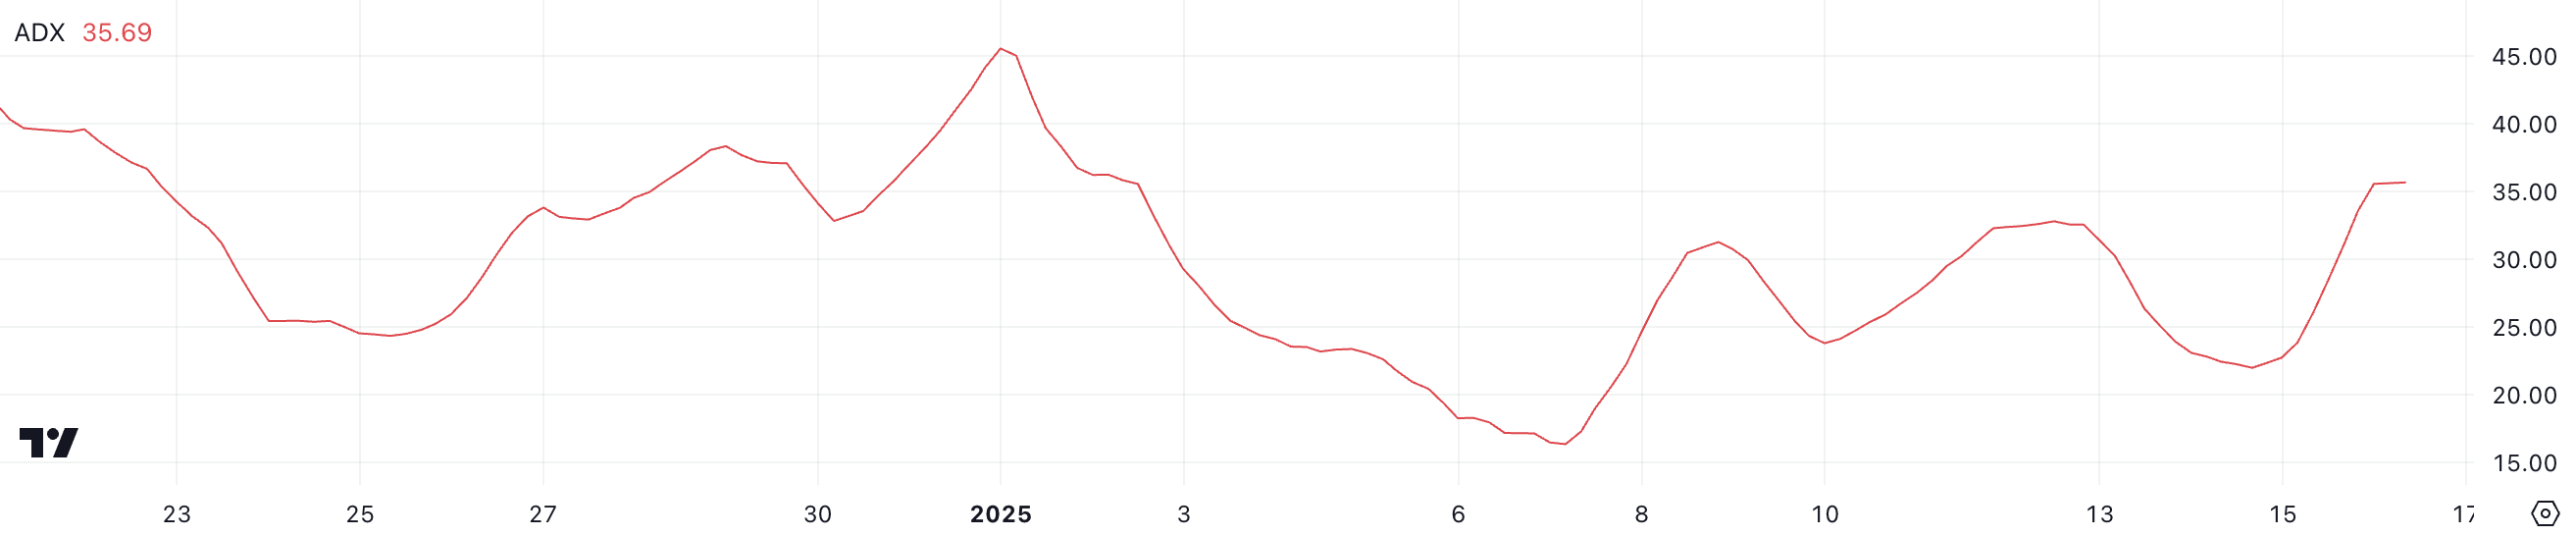
The ADX measures the strength of a trend, with values below 20 indicating weak or range-bound conditions and values above 25 pointing to a strong and defined trend. At 35.6, Sonic ADX reflects solid momentum, supporting the continuation of its upward trajectory.
This level of trend strength, combined with the golden cross, suggests Sonic could see further price gains if buying pressure persists. However, any stalling in the ADX could indicate fading momentum, potentially leading to consolidation or a pullback.
Sonic BBTrend Is Going Down
Sonic BBTrend is currently at -6.8, down significantly from -2.4 just a few hours ago. This sharp decline suggests an increase in bearish pressure and a shift away from potential bullish conditions, indicating a weakening trend in Sonic’s price action.
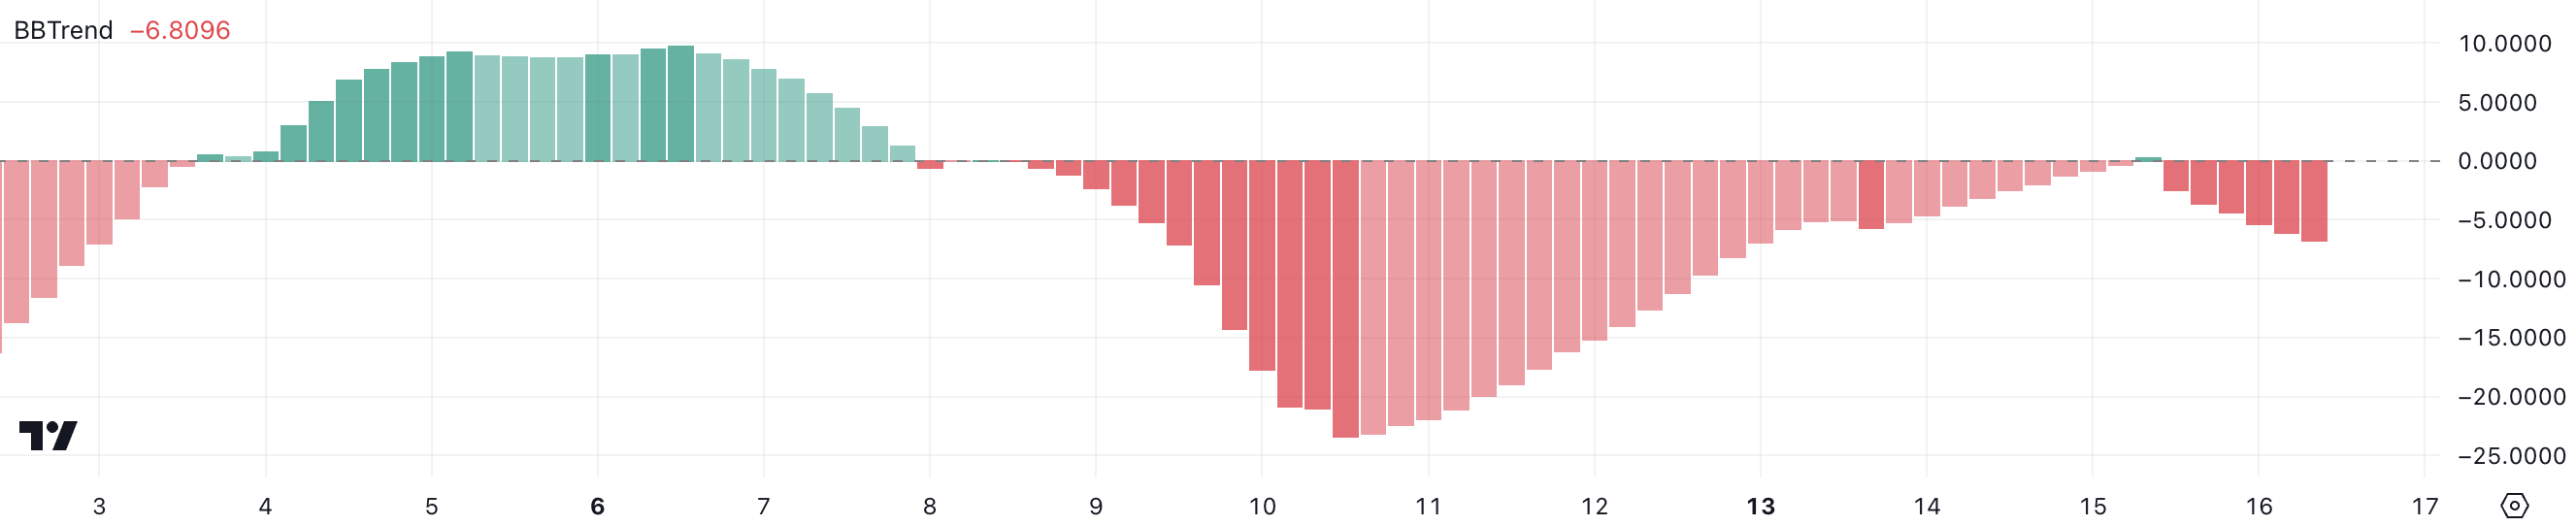
BBTrend is a technical indicator derived from Bollinger Bands, used to measure the strength and direction of a trend. Negative values indicate bearish conditions, while positive values reflect bullish momentum. Sonic’s BBTrend at -6.8 signals growing bearish dominance, suggesting Sonic may face downward pressure in the near term.
If the BBTrend remains negative or declines further, Sonic price could enter a stronger downtrend; however, a recovery toward positive values could signal a potential reversal.
Sonic Price Prediction: Can S Rise to $1 In January?
Sonic EMA lines are showing signs that a new golden cross could form soon, potentially signaling the continuation of its uptrend. If this bullish crossover occurs, Sonic could test the resistance at $0.87, a critical level for its price momentum.
Breaking above $0.87 might allow Sonic price to climb further and test $1.06, representing a potential 34% upside from current levels.
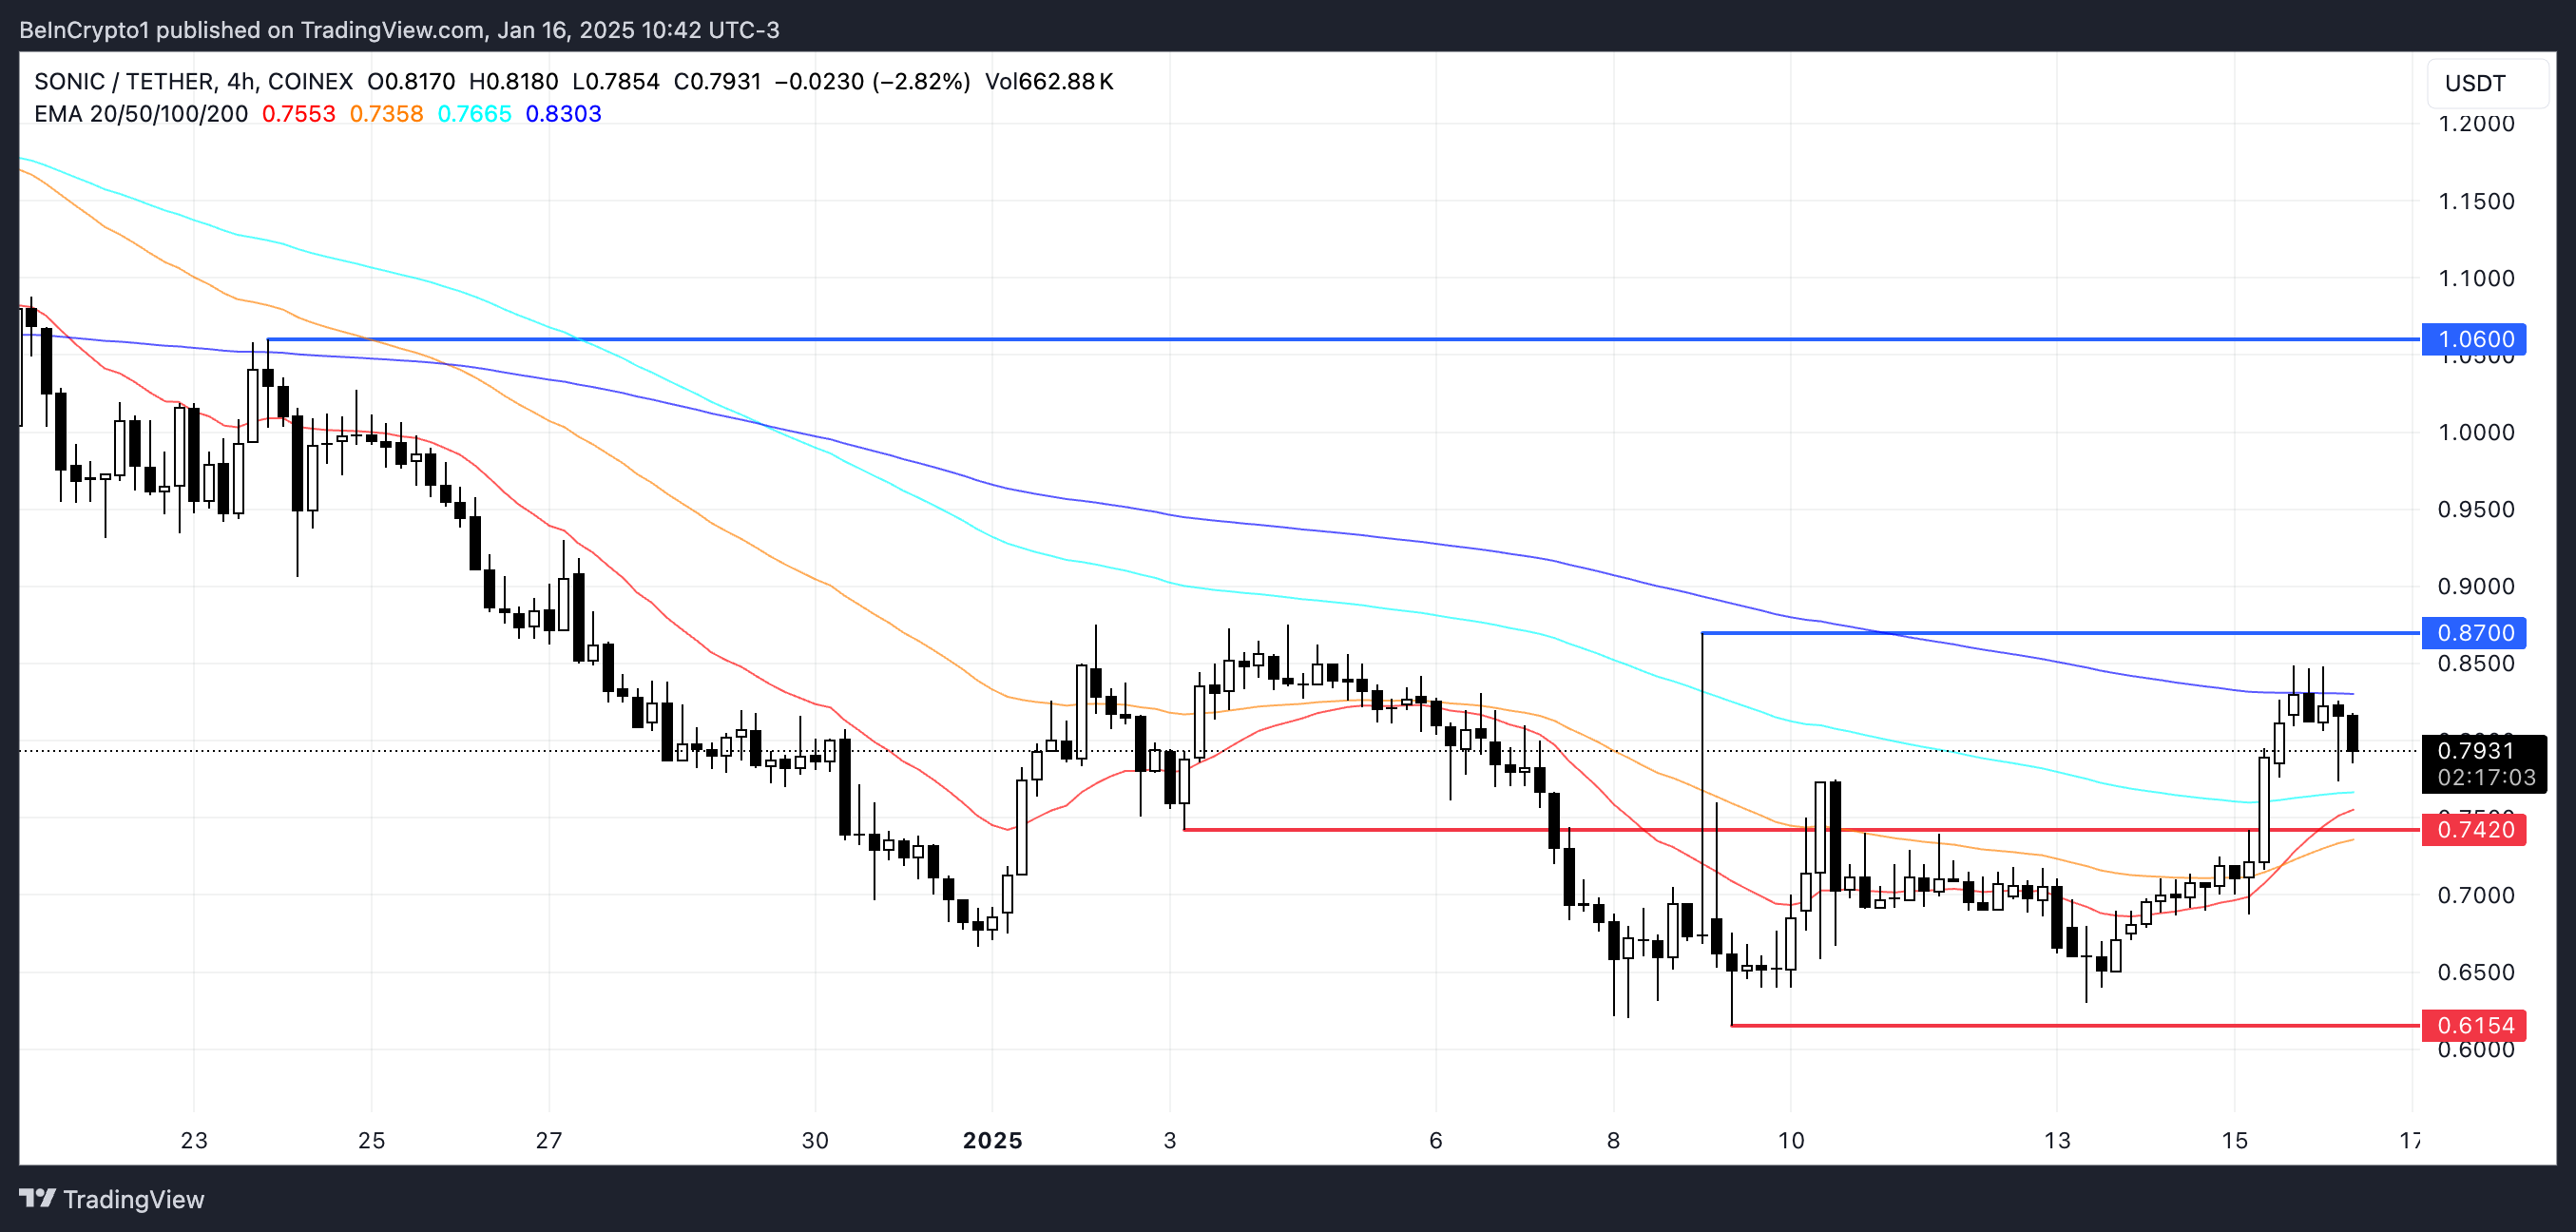
On the other hand, mixed signals from the ADX and BBTrend suggest caution, as they could indicate a weakening trend or a possible reversal. If Sonic price fails to sustain its upward momentum, it could test the support at $0.74.
A break below this level would expose Sonic to further downside, potentially falling to $0.61 and signaling a shift into a bearish phase.
免责声明:投资有风险,本文并非投资建议,以上内容不应被视为任何金融产品的购买或出售要约、建议或邀请,作者或其他用户的任何相关讨论、评论或帖子也不应被视为此类内容。本文仅供一般参考,不考虑您的个人投资目标、财务状况或需求。TTM对信息的准确性和完整性不承担任何责任或保证,投资者应自行研究并在投资前寻求专业建议。
热议股票
- 1
- 2
- 3
- 4
- 5
- 6
- 7
- 8
- 9
- 10