Procter & Gamble Co (NYSE:PG) will be reporting its second-quarter earnings on Wednesday. Wall Street expects $1.86 in EPS and $21.54 billion in revenues as the company reports before market hours.
The stock is up 9.29% over the past year, down 2.64% YTD.
Let’s look at what the charts indicate for Procter & Gamble stock and how the stock currently maps against Wall Street estimates.
Read Also: Dogs Of The Dow: Top 10 High-Yield Stocks Offering Dividends Up To 6.8% In 2025
PG Stock Chart Bearish Ahead Of Q2 Earnings
PG stock is showing a strongly bearish trend, with its price of $161.59 trading below its five, 20 and 50-day exponential moving averages.
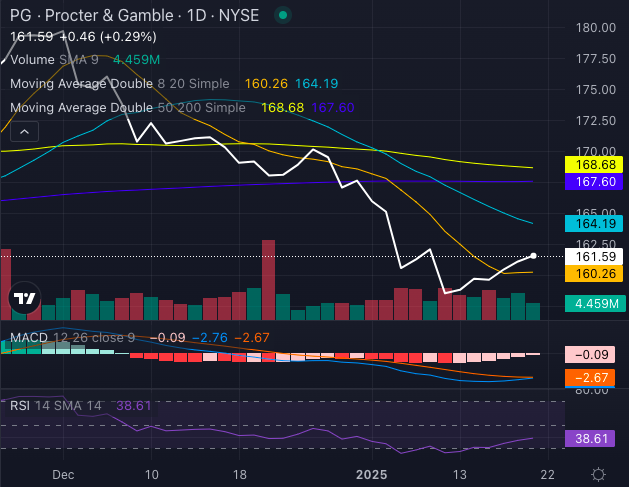
Chart created using Benzinga Pro
While slight buying pressure is evident as the eight-day SMA (simple moving average) at $160.26 signals a bullish move, the broader setup remains bearish, with the 20-day SMA at $164.19, 50-day SMA at $168.68, and 200-day SMA at $167.60 all above the current price.
The MACD (moving average convergence/divergence) indicator at a negative 2.76 reinforces downside momentum, while the RSI (relative strength index) at 38.61 suggests the stock is nearing oversold territory but not there yet.
Procter & Gamble Analysts See 4% Upside
Ratings & Consensus Estimates: The consensus analyst rating on Procter & Gamble stock stands at a Buy currently with a price target of $175.42. The latest analyst ratings from Barclays, Stifel, and UBS give PG stock an average price target of $168.33, implying a 4.01% upside.
PG Price Action: Procter & Gamble stock was trading at $161.63 at the time of publication.
Read Next:
- Jim Cramer’s Market Outlook: Strong Earnings, Trump Inauguration, and What’s Next for Investors