EDU Holdings Limited (ASX:EDU) Stock Rockets 33% But Many Are Still Ignoring The Company
EDU Holdings Limited (ASX:EDU) shares have continued their recent momentum with a 33% gain in the last month alone. Unfortunately, despite the strong performance over the last month, the full year gain of 4.3% isn't as attractive.
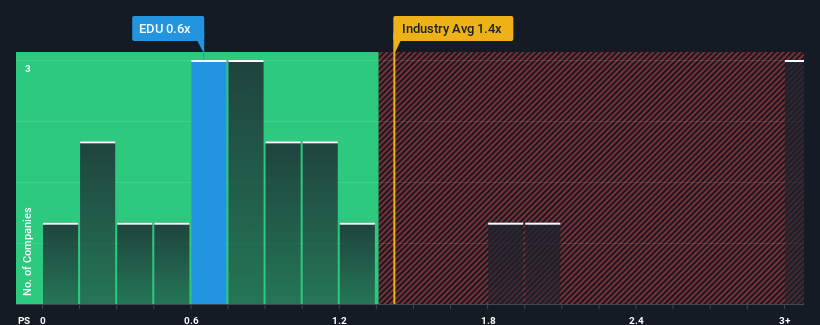
In spite of the firm bounce in price, it's still not a stretch to say that EDU Holdings' price-to-sales (or "P/S") ratio of 0.6x right now seems quite "middle-of-the-road" compared to the Consumer Services industry in Australia, where the median P/S ratio is around 0.8x. Although, it's not wise to simply ignore the P/S without explanation as investors may be disregarding a distinct opportunity or a costly mistake.
View our latest analysis for EDU Holdings
What Does EDU Holdings' P/S Mean For Shareholders?
Recent times have been quite advantageous for EDU Holdings as its revenue has been rising very briskly. The P/S is probably moderate because investors think this strong revenue growth might not be enough to outperform the broader industry in the near future. Those who are bullish on EDU Holdings will be hoping that this isn't the case, so that they can pick up the stock at a lower valuation.
Although there are no analyst estimates available for EDU Holdings, take a look at this free data-rich visualisation to see how the company stacks up on earnings, revenue and cash flow.Do Revenue Forecasts Match The P/S Ratio?
There's an inherent assumption that a company should be matching the industry for P/S ratios like EDU Holdings' to be considered reasonable.
Taking a look back first, we see that the company grew revenue by an impressive 48% last year. The latest three year period has also seen a 20% overall rise in revenue, aided extensively by its short-term performance. Therefore, it's fair to say the revenue growth recently has been respectable for the company.
When compared to the industry's one-year growth forecast of 1.4%, the most recent medium-term revenue trajectory is noticeably more alluring
In light of this, it's curious that EDU Holdings' P/S sits in line with the majority of other companies. Apparently some shareholders believe the recent performance is at its limits and have been accepting lower selling prices.
What Does EDU Holdings' P/S Mean For Investors?
EDU Holdings' stock has a lot of momentum behind it lately, which has brought its P/S level with the rest of the industry. We'd say the price-to-sales ratio's power isn't primarily as a valuation instrument but rather to gauge current investor sentiment and future expectations.
To our surprise, EDU Holdings revealed its three-year revenue trends aren't contributing to its P/S as much as we would have predicted, given they look better than current industry expectations. There could be some unobserved threats to revenue preventing the P/S ratio from matching this positive performance. While recent revenue trends over the past medium-term suggest that the risk of a price decline is low, investors appear to see the likelihood of revenue fluctuations in the future.
It is also worth noting that we have found 3 warning signs for EDU Holdings (2 are potentially serious!) that you need to take into consideration.
If strong companies turning a profit tickle your fancy, then you'll want to check out this free list of interesting companies that trade on a low P/E (but have proven they can grow earnings).
Valuation is complex, but we're here to simplify it.
Discover if EDU Holdings might be undervalued or overvalued with our detailed analysis, featuring fair value estimates, potential risks, dividends, insider trades, and its financial condition.
Access Free AnalysisHave feedback on this article? Concerned about the content? Get in touch with us directly. Alternatively, email editorial-team (at) simplywallst.com.This article by Simply Wall St is general in nature. We provide commentary based on historical data and analyst forecasts only using an unbiased methodology and our articles are not intended to be financial advice. It does not constitute a recommendation to buy or sell any stock, and does not take account of your objectives, or your financial situation. We aim to bring you long-term focused analysis driven by fundamental data. Note that our analysis may not factor in the latest price-sensitive company announcements or qualitative material. Simply Wall St has no position in any stocks mentioned.
免责声明:投资有风险,本文并非投资建议,以上内容不应被视为任何金融产品的购买或出售要约、建议或邀请,作者或其他用户的任何相关讨论、评论或帖子也不应被视为此类内容。本文仅供一般参考,不考虑您的个人投资目标、财务状况或需求。TTM对信息的准确性和完整性不承担任何责任或保证,投资者应自行研究并在投资前寻求专业建议。
热议股票
- 1
- 2
- 3
- 4
- 5
- 6
- 7
- 8
- 9
- 10