Investors in Suncorp Group (ASX:SUN) have seen splendid returns of 107% over the past three years
By buying an index fund, investors can approximate the average market return. But if you pick the right individual stocks, you could make more than that. For example, the Suncorp Group Limited (ASX:SUN) share price is up 82% in the last three years, clearly besting the market return of around 12% (not including dividends). However, more recent returns haven't been as impressive as that, with the stock returning just 52% in the last year, including dividends.
So let's assess the underlying fundamentals over the last 3 years and see if they've moved in lock-step with shareholder returns.
Check out our latest analysis for Suncorp Group
There is no denying that markets are sometimes efficient, but prices do not always reflect underlying business performance. One flawed but reasonable way to assess how sentiment around a company has changed is to compare the earnings per share (EPS) with the share price.
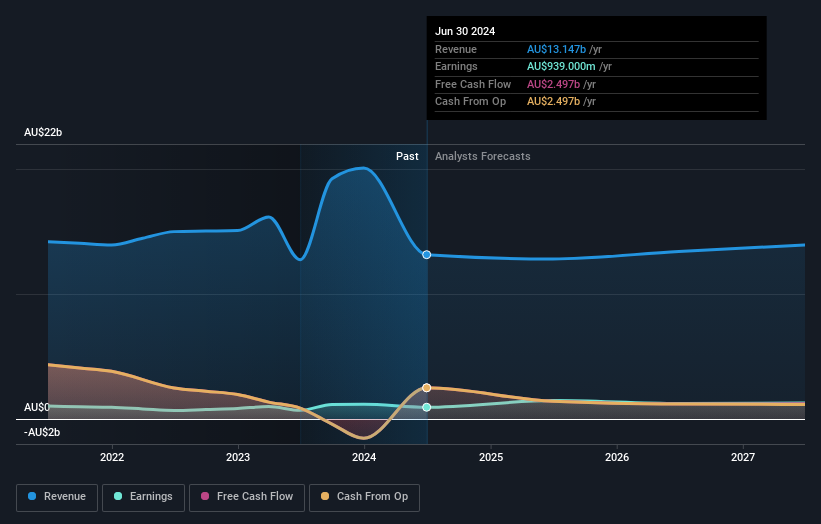
During the three years of share price growth, Suncorp Group actually saw its earnings per share (EPS) drop 3.0% per year.
Given the share price resilience, we don't think the (declining) EPS numbers are a good measure of how the business is moving forward, right now. So other metrics may hold the key to understanding what is influencing investors.
It could be that the revenue growth of 6.0% per year is viewed as evidence that Suncorp Group is growing. If the company is being managed for the long term good, today's shareholders might be right to hold on.
The image below shows how earnings and revenue have tracked over time (if you click on the image you can see greater detail).
Suncorp Group is well known by investors, and plenty of clever analysts have tried to predict the future profit levels. If you are thinking of buying or selling Suncorp Group stock, you should check out this free report showing analyst consensus estimates for future profits.
What About Dividends?
When looking at investment returns, it is important to consider the difference between total shareholder return (TSR) and share price return. Whereas the share price return only reflects the change in the share price, the TSR includes the value of dividends (assuming they were reinvested) and the benefit of any discounted capital raising or spin-off. So for companies that pay a generous dividend, the TSR is often a lot higher than the share price return. We note that for Suncorp Group the TSR over the last 3 years was 107%, which is better than the share price return mentioned above. This is largely a result of its dividend payments!
A Different Perspective
It's nice to see that Suncorp Group shareholders have received a total shareholder return of 52% over the last year. Of course, that includes the dividend. That's better than the annualised return of 15% over half a decade, implying that the company is doing better recently. In the best case scenario, this may hint at some real business momentum, implying that now could be a great time to delve deeper. It's always interesting to track share price performance over the longer term. But to understand Suncorp Group better, we need to consider many other factors. Consider for instance, the ever-present spectre of investment risk. We've identified 1 warning sign with Suncorp Group , and understanding them should be part of your investment process.
Of course, you might find a fantastic investment by looking elsewhere. So take a peek at this free list of companies we expect will grow earnings.
Please note, the market returns quoted in this article reflect the market weighted average returns of stocks that currently trade on Australian exchanges.
New: Manage All Your Stock Portfolios in One Place
We've created the ultimate portfolio companion for stock investors, and it's free.
• Connect an unlimited number of Portfolios and see your total in one currency• Be alerted to new Warning Signs or Risks via email or mobile• Track the Fair Value of your stocks
Try a Demo Portfolio for FreeHave feedback on this article? Concerned about the content? Get in touch with us directly. Alternatively, email editorial-team (at) simplywallst.com.This article by Simply Wall St is general in nature. We provide commentary based on historical data and analyst forecasts only using an unbiased methodology and our articles are not intended to be financial advice. It does not constitute a recommendation to buy or sell any stock, and does not take account of your objectives, or your financial situation. We aim to bring you long-term focused analysis driven by fundamental data. Note that our analysis may not factor in the latest price-sensitive company announcements or qualitative material. Simply Wall St has no position in any stocks mentioned.
免责声明:投资有风险,本文并非投资建议,以上内容不应被视为任何金融产品的购买或出售要约、建议或邀请,作者或其他用户的任何相关讨论、评论或帖子也不应被视为此类内容。本文仅供一般参考,不考虑您的个人投资目标、财务状况或需求。TTM对信息的准确性和完整性不承担任何责任或保证,投资者应自行研究并在投资前寻求专业建议。
热议股票
- 1
- 2
- 3
- 4
- 5
- 6
- 7
- 8
- 9
- 10