Bosideng International Holdings Limited's (HKG:3998) Fundamentals Look Pretty Strong: Could The Market Be Wrong About The Stock?
Bosideng International Holdings (HKG:3998) has had a rough three months with its share price down 15%. However, a closer look at its sound financials might cause you to think again. Given that fundamentals usually drive long-term market outcomes, the company is worth looking at. Particularly, we will be paying attention to Bosideng International Holdings' ROE today.
Return on Equity or ROE is a test of how effectively a company is growing its value and managing investors’ money. Simply put, it is used to assess the profitability of a company in relation to its equity capital.
Check out our latest analysis for Bosideng International Holdings
How Is ROE Calculated?
The formula for return on equity is:
Return on Equity = Net Profit (from continuing operations) ÷ Shareholders' Equity
So, based on the above formula, the ROE for Bosideng International Holdings is:
25% = CN¥3.3b ÷ CN¥13b (Based on the trailing twelve months to September 2024).
The 'return' is the profit over the last twelve months. One way to conceptualize this is that for each HK$1 of shareholders' capital it has, the company made HK$0.25 in profit.
What Is The Relationship Between ROE And Earnings Growth?
So far, we've learned that ROE is a measure of a company's profitability. We now need to evaluate how much profit the company reinvests or "retains" for future growth which then gives us an idea about the growth potential of the company. Assuming all else is equal, companies that have both a higher return on equity and higher profit retention are usually the ones that have a higher growth rate when compared to companies that don't have the same features.
Bosideng International Holdings' Earnings Growth And 25% ROE
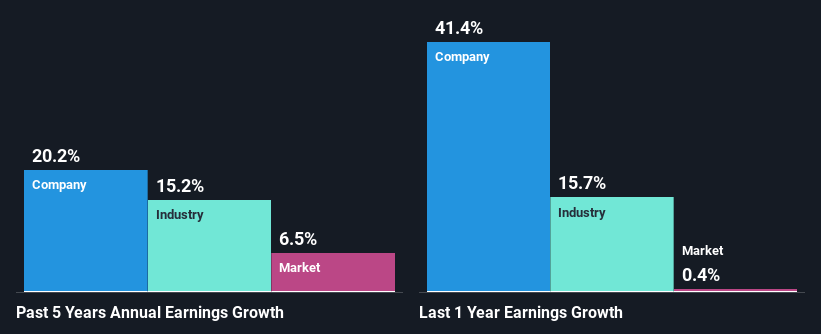
To begin with, Bosideng International Holdings has a pretty high ROE which is interesting. Additionally, the company's ROE is higher compared to the industry average of 11% which is quite remarkable. As a result, Bosideng International Holdings' exceptional 20% net income growth seen over the past five years, doesn't come as a surprise.
Next, on comparing with the industry net income growth, we found that Bosideng International Holdings' growth is quite high when compared to the industry average growth of 15% in the same period, which is great to see.
The basis for attaching value to a company is, to a great extent, tied to its earnings growth. The investor should try to establish if the expected growth or decline in earnings, whichever the case may be, is priced in. By doing so, they will have an idea if the stock is headed into clear blue waters or if swampy waters await. Has the market priced in the future outlook for 3998? You can find out in our latest intrinsic value infographic research report.
Is Bosideng International Holdings Efficiently Re-investing Its Profits?
The high three-year median payout ratio of 77% (implying that it keeps only 23% of profits) for Bosideng International Holdings suggests that the company's growth wasn't really hampered despite it returning most of the earnings to its shareholders.
Moreover, Bosideng International Holdings is determined to keep sharing its profits with shareholders which we infer from its long history of paying a dividend for at least ten years. Existing analyst estimates suggest that the company's future payout ratio is expected to drop to 46% over the next three years. However, the company's ROE is not expected to change by much despite the lower expected payout ratio.
Conclusion
Overall, we are quite pleased with Bosideng International Holdings' performance. We are particularly impressed by the considerable earnings growth posted by the company, which was likely backed by its high ROE. While the company is paying out most of its earnings as dividends, it has been able to grow its earnings in spite of it, so that's probably a good sign. With that said, the latest industry analyst forecasts reveal that the company's earnings growth is expected to slow down. Are these analysts expectations based on the broad expectations for the industry, or on the company's fundamentals? Click here to be taken to our analyst's forecasts page for the company.
Valuation is complex, but we're here to simplify it.
Discover if Bosideng International Holdings might be undervalued or overvalued with our detailed analysis, featuring fair value estimates, potential risks, dividends, insider trades, and its financial condition.
Access Free AnalysisHave feedback on this article? Concerned about the content? Get in touch with us directly. Alternatively, email editorial-team (at) simplywallst.com.This article by Simply Wall St is general in nature. We provide commentary based on historical data and analyst forecasts only using an unbiased methodology and our articles are not intended to be financial advice. It does not constitute a recommendation to buy or sell any stock, and does not take account of your objectives, or your financial situation. We aim to bring you long-term focused analysis driven by fundamental data. Note that our analysis may not factor in the latest price-sensitive company announcements or qualitative material. Simply Wall St has no position in any stocks mentioned.
免责声明:投资有风险,本文并非投资建议,以上内容不应被视为任何金融产品的购买或出售要约、建议或邀请,作者或其他用户的任何相关讨论、评论或帖子也不应被视为此类内容。本文仅供一般参考,不考虑您的个人投资目标、财务状况或需求。TTM对信息的准确性和完整性不承担任何责任或保证,投资者应自行研究并在投资前寻求专业建议。
热议股票
- 1
- 2
- 3
- 4
- 5
- 6
- 7
- 8
- 9
- 10