ANE (Cayman) Inc.'s (HKG:9956) market cap dropped HK$417m last week; Individual investors bore the brunt
Key Insights
- Significant control over ANE (Cayman) by individual investors implies that the general public has more power to influence management and governance-related decisions
- A total of 25 investors have a majority stake in the company with 50% ownership
- Ownership research along with analyst forecasts data help provide a good understanding of opportunities in a stock
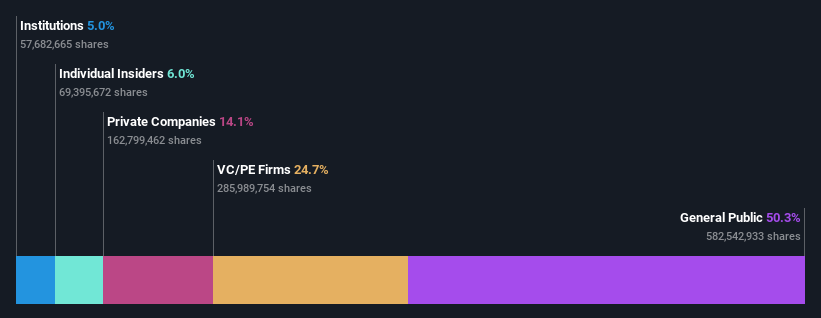
To get a sense of who is truly in control of ANE (Cayman) Inc. (HKG:9956), it is important to understand the ownership structure of the business. The group holding the most number of shares in the company, around 50% to be precise, is individual investors. In other words, the group stands to gain the most (or lose the most) from their investment into the company.
And following last week's 5.0% decline in share price, individual investors suffered the most losses.
Let's delve deeper into each type of owner of ANE (Cayman), beginning with the chart below.
Check out our latest analysis for ANE (Cayman)
What Does The Institutional Ownership Tell Us About ANE (Cayman)?
Institutions typically measure themselves against a benchmark when reporting to their own investors, so they often become more enthusiastic about a stock once it's included in a major index. We would expect most companies to have some institutions on the register, especially if they are growing.
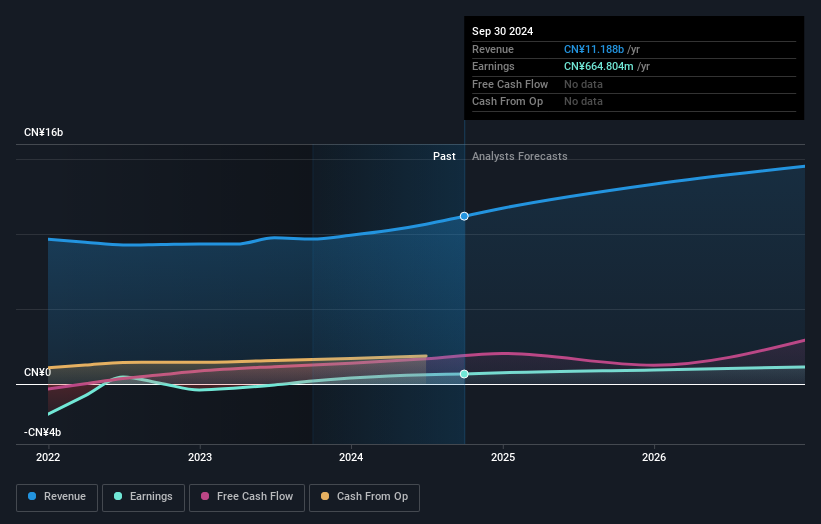
Less than 5% of ANE (Cayman) is held by institutional investors. This suggests that some funds have the company in their sights, but many have not yet bought shares in it. So if the company itself can improve over time, we may well see more institutional buyers in the future. When multiple institutional investors want to buy shares, we often see a rising share price. The past revenue trajectory (shown below) can be an indication of future growth, but there are no guarantees.
Hedge funds don't have many shares in ANE (Cayman). The company's largest shareholder is Centurium Capital Management Ltd., with ownership of 25%. Meanwhile, the second and third largest shareholders, hold 9.4% and 4.7%, of the shares outstanding, respectively. Furthermore, CEO Xinghua Qin is the owner of 3.1% of the company's shares.
Our studies suggest that the top 25 shareholders collectively control less than half of the company's shares, meaning that the company's shares are widely disseminated and there is no dominant shareholder.
While it makes sense to study institutional ownership data for a company, it also makes sense to study analyst sentiments to know which way the wind is blowing. There are a reasonable number of analysts covering the stock, so it might be useful to find out their aggregate view on the future.
Insider Ownership Of ANE (Cayman)
The definition of an insider can differ slightly between different countries, but members of the board of directors always count. Company management run the business, but the CEO will answer to the board, even if he or she is a member of it.
Most consider insider ownership a positive because it can indicate the board is well aligned with other shareholders. However, on some occasions too much power is concentrated within this group.
Our most recent data indicates that insiders own some shares in ANE (Cayman) Inc.. It is a pretty big company, so it is generally a positive to see some potentially meaningful alignment. In this case, they own around HK$475m worth of shares (at current prices). It is good to see this level of investment by insiders. You can check here to see if those insiders have been buying recently.
General Public Ownership
The general public -- including retail investors -- own 50% of ANE (Cayman). This level of ownership gives investors from the wider public some power to sway key policy decisions such as board composition, executive compensation, and the dividend payout ratio.
Private Equity Ownership
With a stake of 25%, private equity firms could influence the ANE (Cayman) board. Some investors might be encouraged by this, since private equity are sometimes able to encourage strategies that help the market see the value in the company. Alternatively, those holders might be exiting the investment after taking it public.
Private Company Ownership
It seems that Private Companies own 14%, of the ANE (Cayman) stock. It's hard to draw any conclusions from this fact alone, so its worth looking into who owns those private companies. Sometimes insiders or other related parties have an interest in shares in a public company through a separate private company.
Next Steps:
While it is well worth considering the different groups that own a company, there are other factors that are even more important.
I like to dive deeper into how a company has performed in the past. You can access this interactive graph of past earnings, revenue and cash flow, for free.
But ultimately it is the future, not the past, that will determine how well the owners of this business will do. Therefore we think it advisable to take a look at this free report showing whether analysts are predicting a brighter future.
NB: Figures in this article are calculated using data from the last twelve months, which refer to the 12-month period ending on the last date of the month the financial statement is dated. This may not be consistent with full year annual report figures.
New: Manage All Your Stock Portfolios in One Place
We've created the ultimate portfolio companion for stock investors, and it's free.
• Connect an unlimited number of Portfolios and see your total in one currency• Be alerted to new Warning Signs or Risks via email or mobile• Track the Fair Value of your stocks
Try a Demo Portfolio for FreeHave feedback on this article? Concerned about the content? Get in touch with us directly. Alternatively, email editorial-team (at) simplywallst.com.This article by Simply Wall St is general in nature. We provide commentary based on historical data and analyst forecasts only using an unbiased methodology and our articles are not intended to be financial advice. It does not constitute a recommendation to buy or sell any stock, and does not take account of your objectives, or your financial situation. We aim to bring you long-term focused analysis driven by fundamental data. Note that our analysis may not factor in the latest price-sensitive company announcements or qualitative material. Simply Wall St has no position in any stocks mentioned.
免责声明:投资有风险,本文并非投资建议,以上内容不应被视为任何金融产品的购买或出售要约、建议或邀请,作者或其他用户的任何相关讨论、评论或帖子也不应被视为此类内容。本文仅供一般参考,不考虑您的个人投资目标、财务状况或需求。TTM对信息的准确性和完整性不承担任何责任或保证,投资者应自行研究并在投资前寻求专业建议。
热议股票
- 1
- 2
- 3
- 4
- 5
- 6
- 7
- 8
- 9
- 10