Even after rising 14% this past week, Alphamab Oncology (HKG:9966) shareholders are still down 78% over the past five years
Alphamab Oncology (HKG:9966) shareholders should be happy to see the share price up 16% in the last month. But that doesn't change the fact that the returns over the last half decade have been stomach churning. Like a ship taking on water, the share price has sunk 78% in that time. It's true that the recent bounce could signal the company is turning over a new leaf, but we are not so sure. The important question is if the business itself justifies a higher share price in the long term.
The recent uptick of 14% could be a positive sign of things to come, so let's take a look at historical fundamentals.
Check out our latest analysis for Alphamab Oncology
Alphamab Oncology wasn't profitable in the last twelve months, it is unlikely we'll see a strong correlation between its share price and its earnings per share (EPS). Arguably revenue is our next best option. Shareholders of unprofitable companies usually desire strong revenue growth. That's because it's hard to be confident a company will be sustainable if revenue growth is negligible, and it never makes a profit.
Over five years, Alphamab Oncology grew its revenue at 57% per year. That's well above most other pre-profit companies. So it's not at all clear to us why the share price sunk 12% throughout that time. It could be that the stock was over-hyped before. We'd recommend carefully checking for indications of future growth - and balance sheet threats - before considering a purchase.
You can see how earnings and revenue have changed over time in the image below (click on the chart to see the exact values).
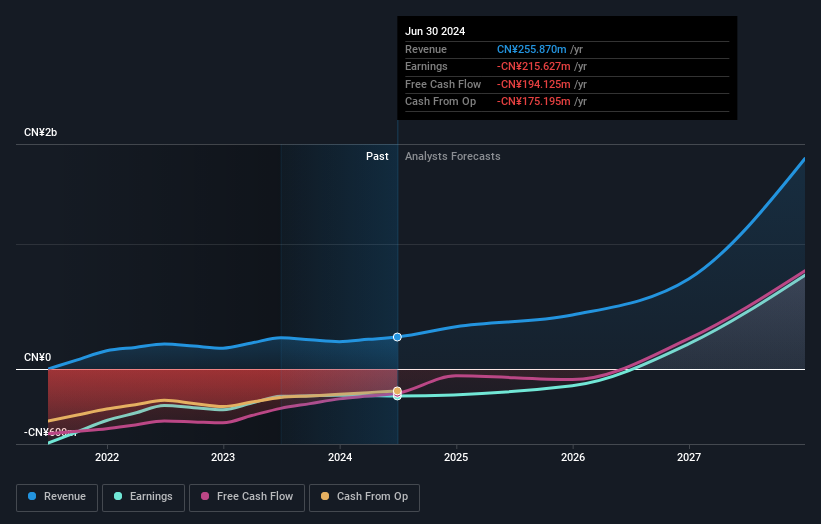
Balance sheet strength is crucial. It might be well worthwhile taking a look at our free report on how its financial position has changed over time.
A Different Perspective
Investors in Alphamab Oncology had a tough year, with a total loss of 11%, against a market gain of about 33%. Even the share prices of good stocks drop sometimes, but we want to see improvements in the fundamental metrics of a business, before getting too interested. Unfortunately, longer term shareholders are suffering worse, given the loss of 12% doled out over the last five years. We'd need to see some sustained improvements in the key metrics before we could muster much enthusiasm. You might want to assess this data-rich visualization of its earnings, revenue and cash flow.
Of course, you might find a fantastic investment by looking elsewhere. So take a peek at this free list of companies we expect will grow earnings.
Please note, the market returns quoted in this article reflect the market weighted average returns of stocks that currently trade on Hong Kong exchanges.
New: Manage All Your Stock Portfolios in One Place
We've created the ultimate portfolio companion for stock investors, and it's free.
• Connect an unlimited number of Portfolios and see your total in one currency• Be alerted to new Warning Signs or Risks via email or mobile• Track the Fair Value of your stocks
Try a Demo Portfolio for FreeHave feedback on this article? Concerned about the content? Get in touch with us directly. Alternatively, email editorial-team (at) simplywallst.com.This article by Simply Wall St is general in nature. We provide commentary based on historical data and analyst forecasts only using an unbiased methodology and our articles are not intended to be financial advice. It does not constitute a recommendation to buy or sell any stock, and does not take account of your objectives, or your financial situation. We aim to bring you long-term focused analysis driven by fundamental data. Note that our analysis may not factor in the latest price-sensitive company announcements or qualitative material. Simply Wall St has no position in any stocks mentioned.
免责声明:投资有风险,本文并非投资建议,以上内容不应被视为任何金融产品的购买或出售要约、建议或邀请,作者或其他用户的任何相关讨论、评论或帖子也不应被视为此类内容。本文仅供一般参考,不考虑您的个人投资目标、财务状况或需求。TTM对信息的准确性和完整性不承担任何责任或保证,投资者应自行研究并在投资前寻求专业建议。
热议股票
- 1
- 2
- 3
- 4
- 5
- 6
- 7
- 8
- 9
- 10